“A quality education can be the most important tool for helping children and families lift themselves out of a recurring pattern of housing instability.”
Introduction
The crisis of family homelessness in the United States continues to fall heaviest on the nation’s most vulnerable: its children. Despite decades of varied policy approaches and a growing body of literature on the impact of homelessness on the development of young bodies and minds, the number of children without a permanent home continues to grow, with close to 1.3 million students in public schools counted as homeless during the 2014–15 school year. Many of these children are trapped in an intergenerational cycle of poverty, with parents who themselves were homeless at a young age. For them, ending homelessness requires more than a place to sleep; it requires the tools to break the cycle.
A quality education can be the most important tool to helping children and families lift themselves out of a recurring pattern of housing instability. To do that, however, these children must first be identified as homeless and then receive the necessary support to ensure that homelessness does not disrupt their learning. To assist educators and policymakers in gauging their own efforts in serving homeless student, the Institute for Children, Poverty, and Homelessness (ICPH) presents Out of the Shadows: A State-by-State Ranking of Accountability for Homeless Students.
Table 1
2017 Overall National Ranking on the Identification of Homeless Students
![]()
At the federal level, there are have been several major policy changes in recent years. First and foremost is the enactment of the Every Student Succeeds Act (ESSA) of 2015. ESSA contained the first amendments to the landmark McKinney-Vento Act in over ten years, including more stringent procedures for schools and school districts in the planning and provision of services to homeless students, better protections for students facing possible school transfers, and an increase in authorized funding for the Education for Homeless Children and Youth (EHCY) program within the U.S. Department of Education (ED).
Historically, ED has been a critical resource in the fight against family homelessness. Although the majority of federal funding and policies related to family homelessness comes from the Department of Housing and Urban Development (HUD), its limited definition of homelessness leads to a significant undercount of families and children without permanent housing of their own. Only ED counts as homeless those children who are staying temporarily with another family or household due to economic hardship. More than three-quarters of all homeless students live in this kind of unstable arrangement, known as “doubled up.” These students are often the hardest to connect with support services, as they are often unaware of their legal rights under McKinney-Vento or reluctant to self-identify as being homeless.
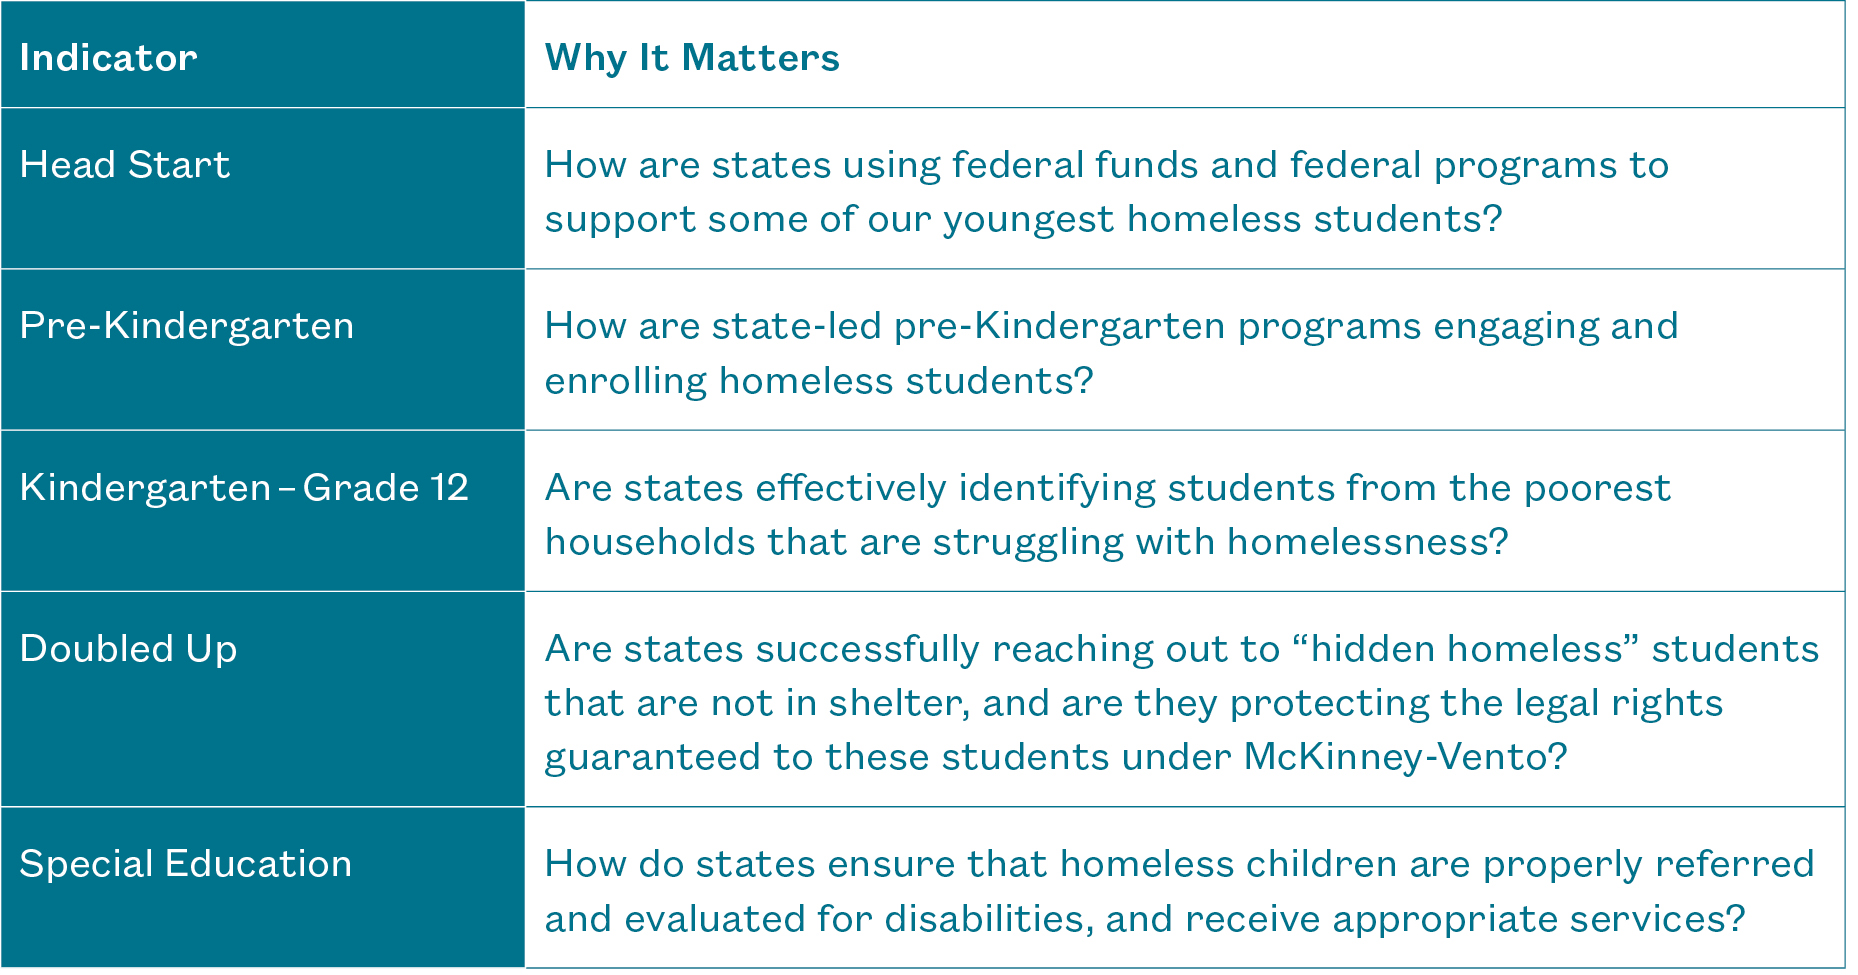
Figure 1
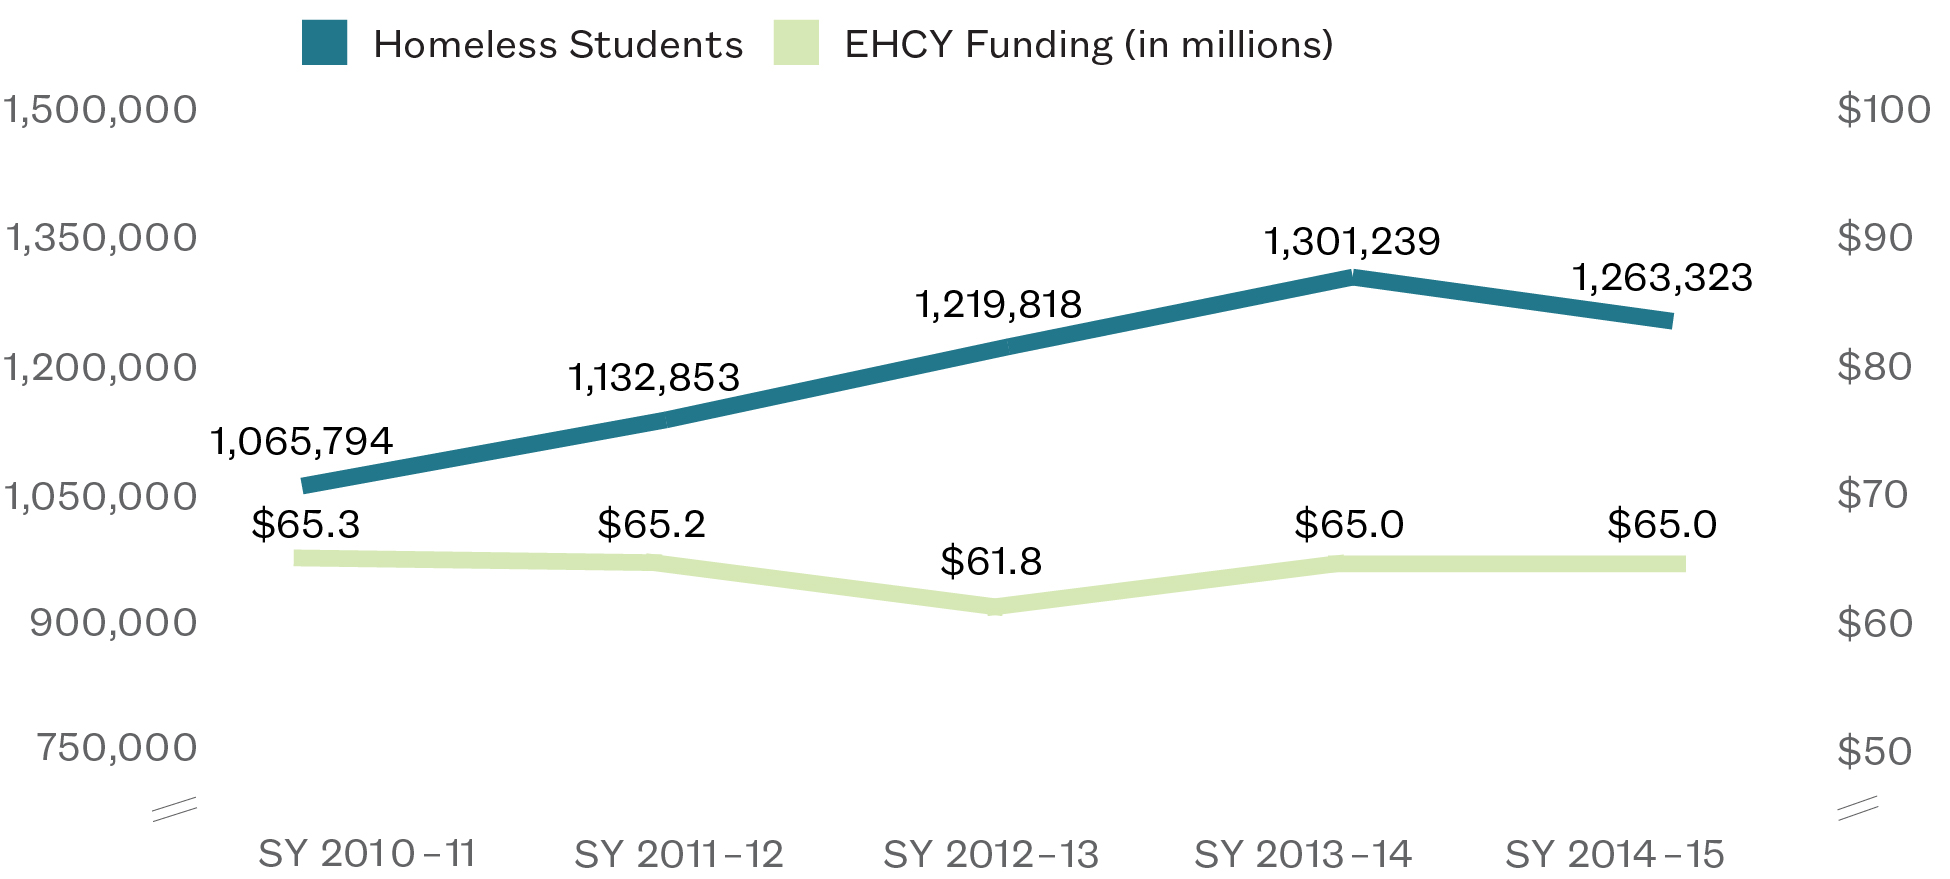
Number of Homeless Students Nationwide
and EHCY Funding
SY 2010–11 to SY 2014–15
Since the 2010–11 school year, the number of homeless students in grades pre-Kindergarten through 12th rose 19%, to just under 1.3 million nationwide. Over the same period, funding for the Education for Homeless Children and Youth program remained steady at $65 million. This has resulted in a decrease in total federal spending per student from $61.26 in SY 2010–11 to $51.48 in SY 2014–15 (with an average allocation to states of $50.08 for every homeless student). Funding for EHCY will increase to $77 million in FY 2017, and an increase up to $85 million by 2020 was authorized under ESSA.
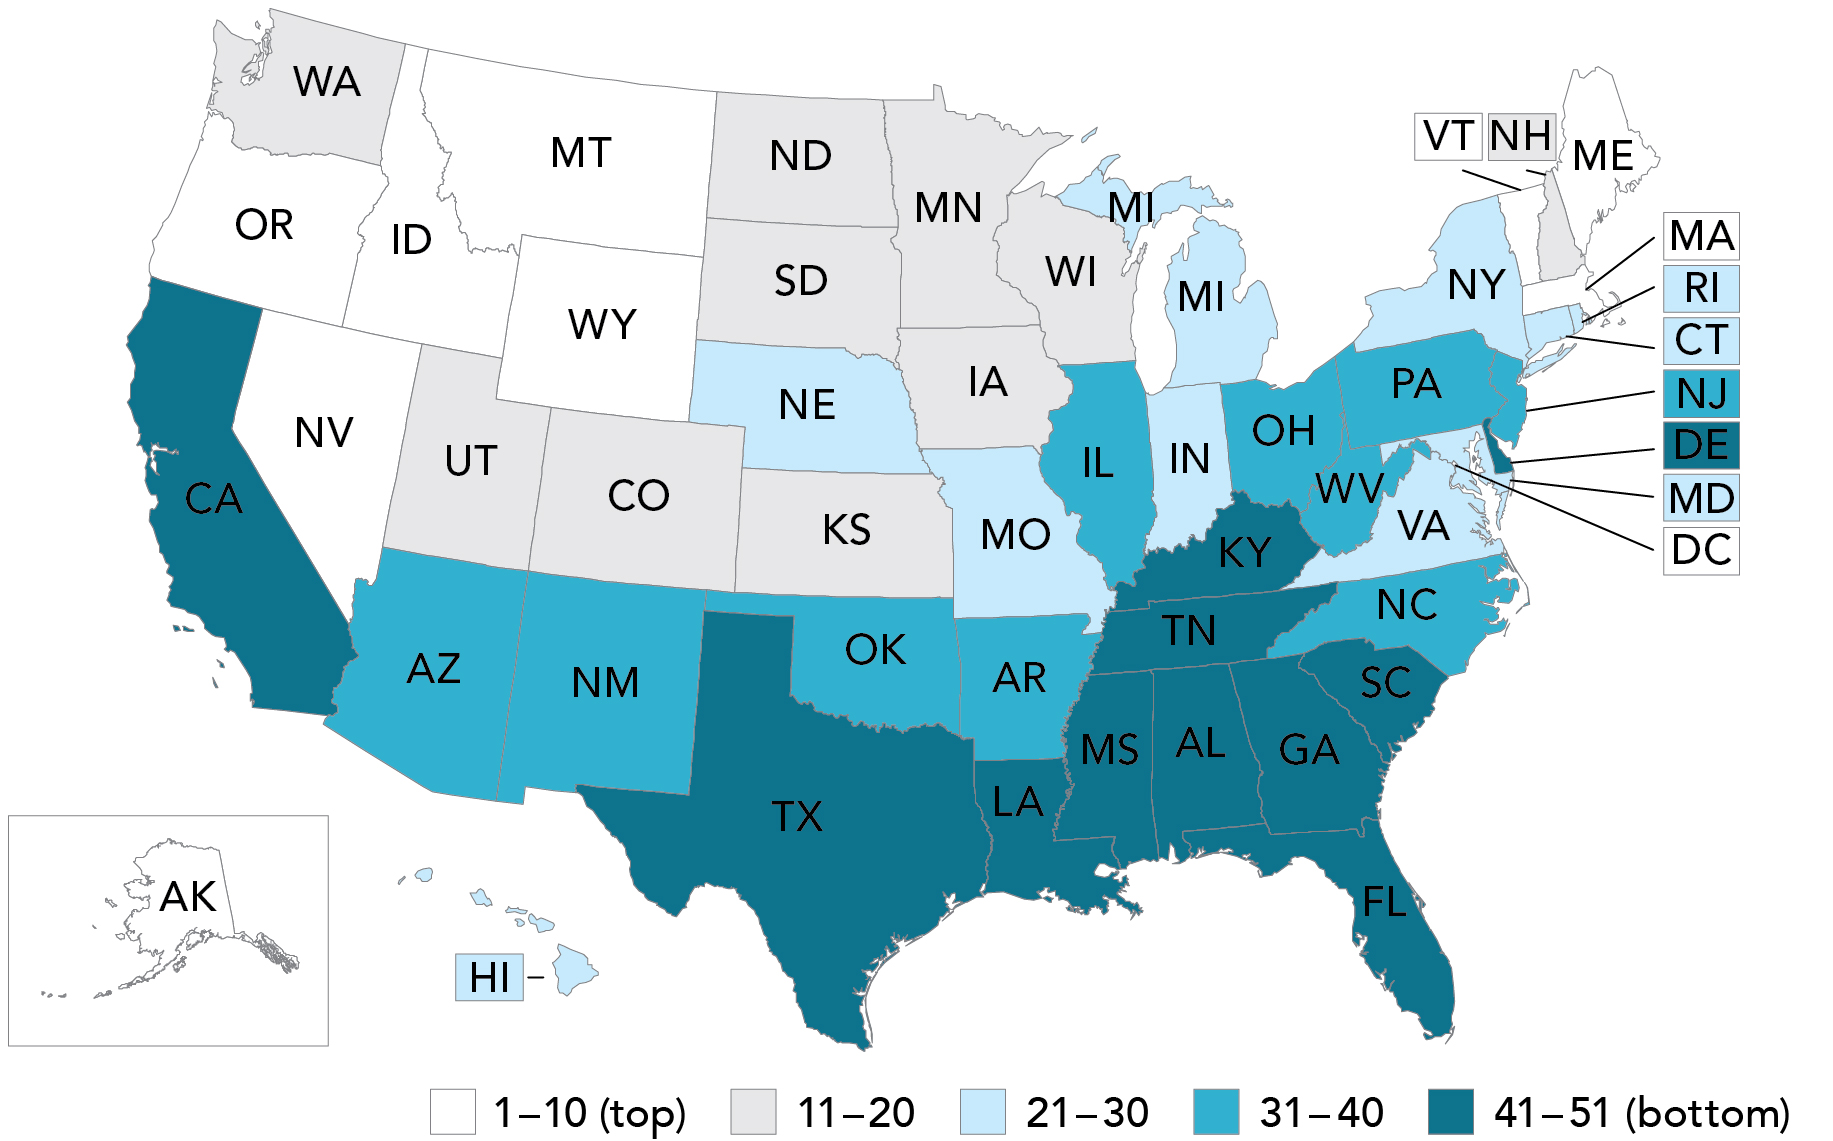
Map 1
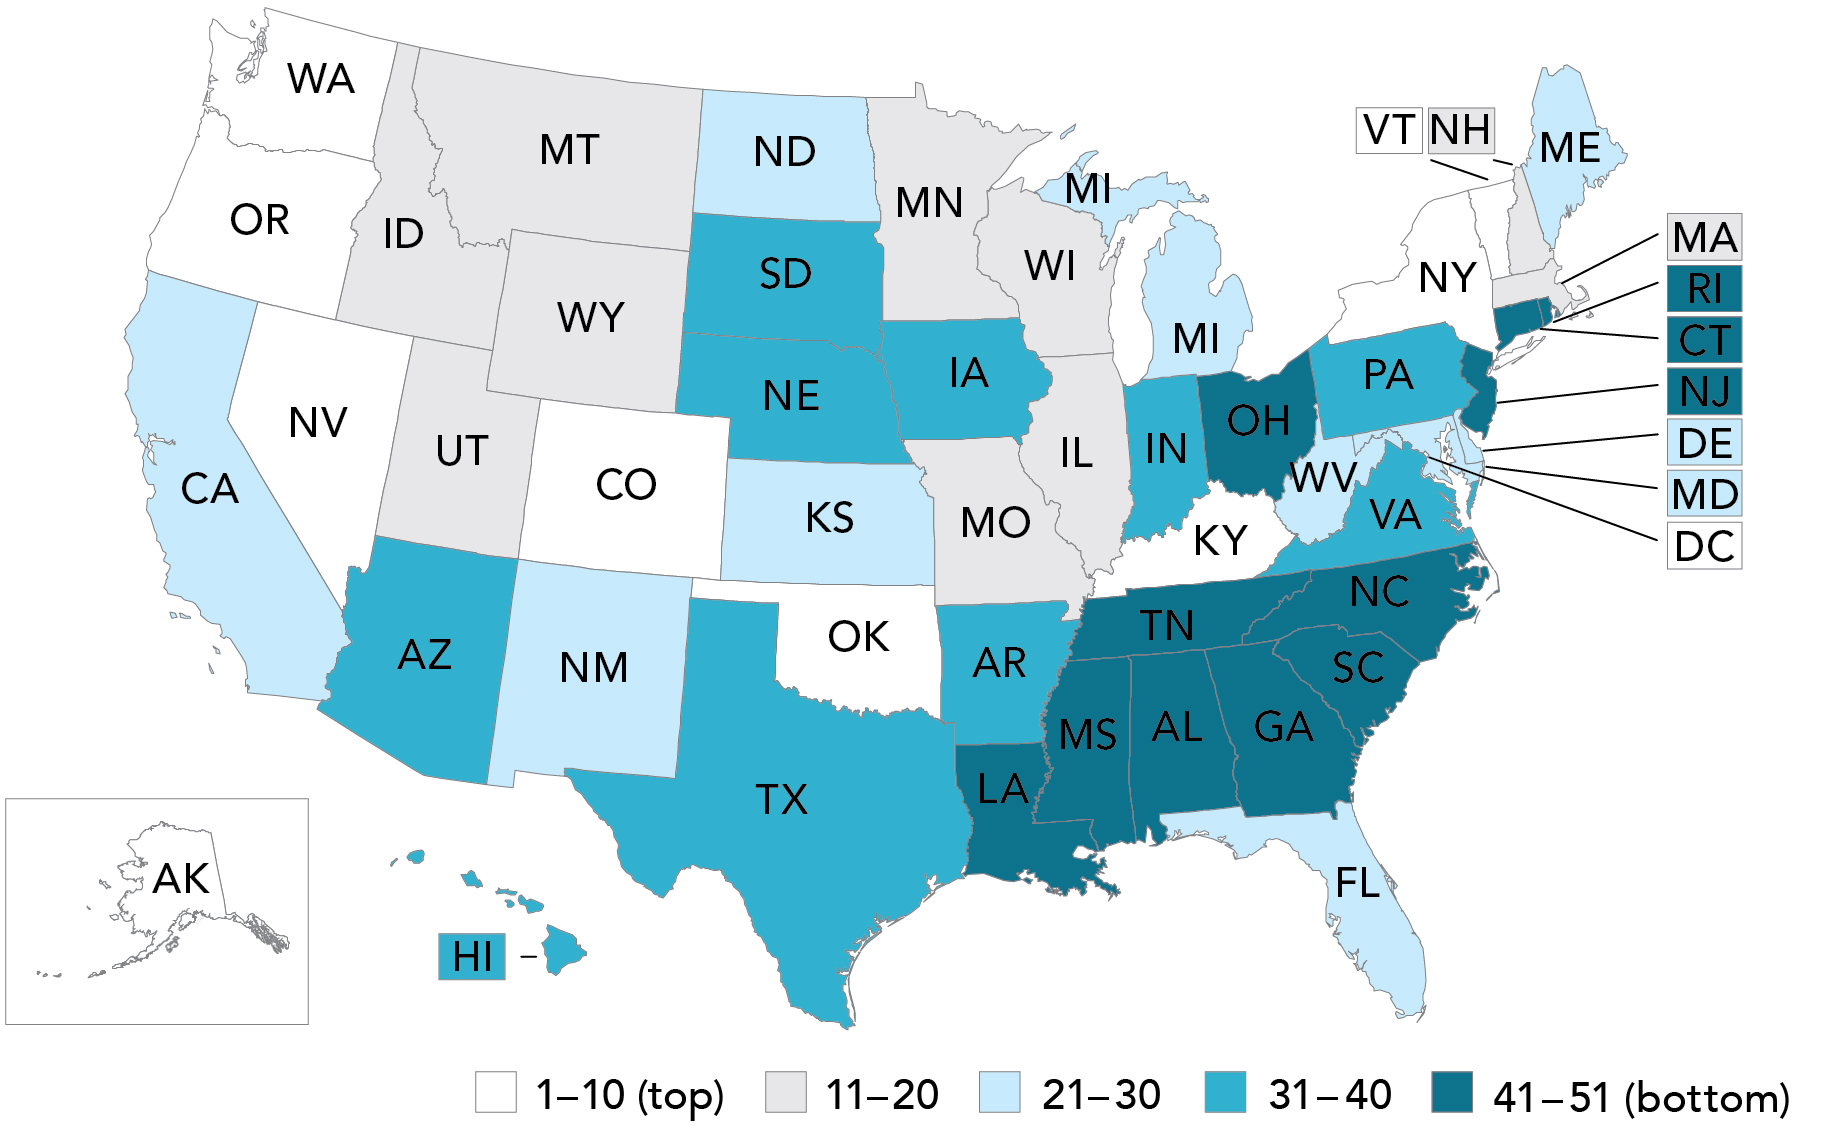
Overall Rankings on the Identification
of Homeless Students
SY 2014–15
Map 2
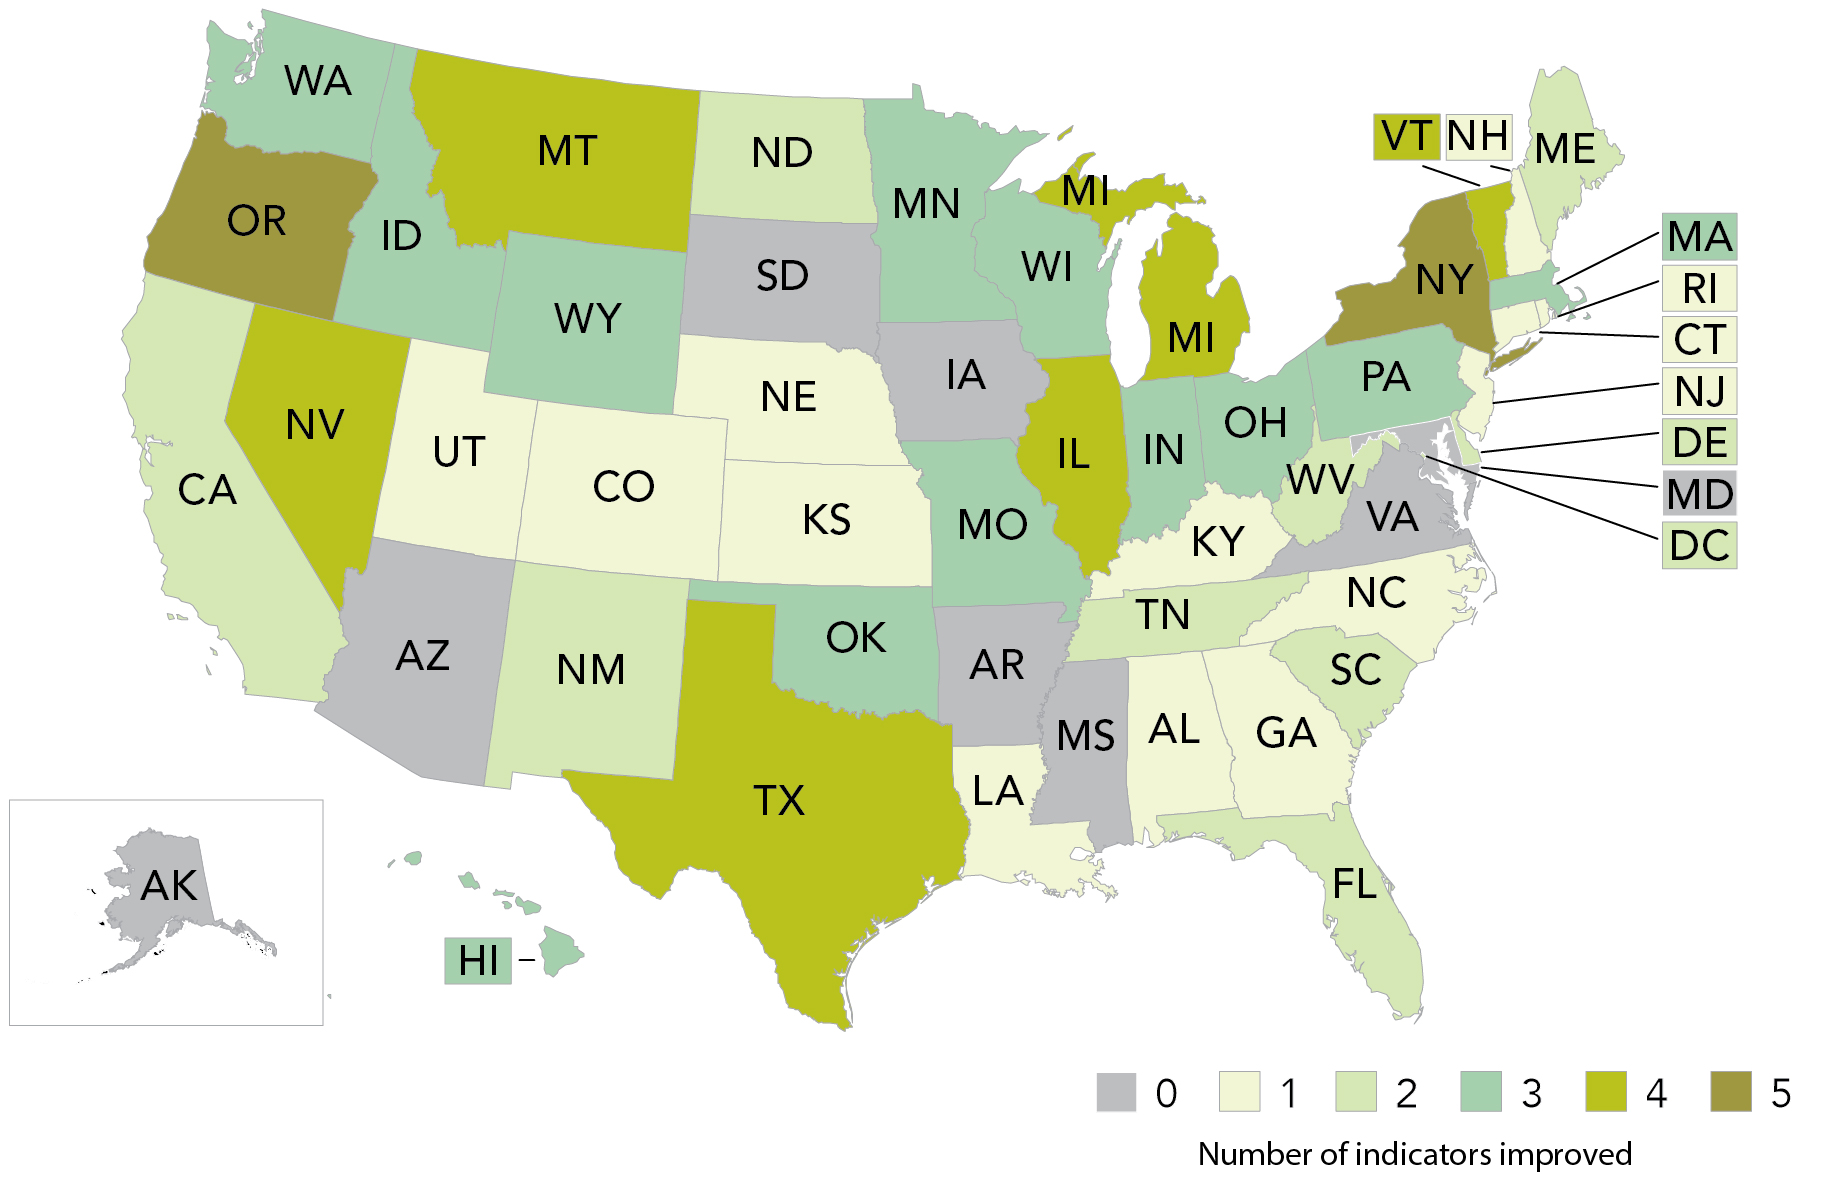
Number of Indicators Improved, by State
SY 2012–13 to SY 2014–15
We selected five indicators on which to hold states accountable for the support and identification of homeless students. ICPH will be releasing in-depth discussions on each of the indicators in the near future. The first two—Head Start and Pre-Kindergarten—both provide a measure of how early childhood programs serve homeless students. The Head Start indicator gives a sense of how states are using federal funds and programs to support students who receive priority within this specific program. As many states are expanding individual pre-Kindergarten programs, this indicator both suggests how well states are serving young homeless children as they expand pre-Kindergarten access and how states might think about improving Kindergarten readiness for homeless students.
We then chose two indicators for Kindergarten–12 education: Homeless Students and Doubled-Up Students. For the Homeless Student indicator, we look at homeless students as a percent of extremely poor children. While we can’t know precisely how many homeless children should be identified within a given state or municipality, this measure is our best proxy for highlighting areas where perhaps homeless students are under-identified. Without identification, services and resources cannot be appropriately allocated. The second Kindergarten–12 indicator looks at the ratio of homeless students living doubled up compared with total Kindergarten–12 enrollment. This indicator can help a state also think about identification, but in addition, our research has shown that understanding the type of homelessness a student experiences matters for effective support and optimal outcomes.
Table 2
Detailed Rankings
on the Identification
of Homeless Students
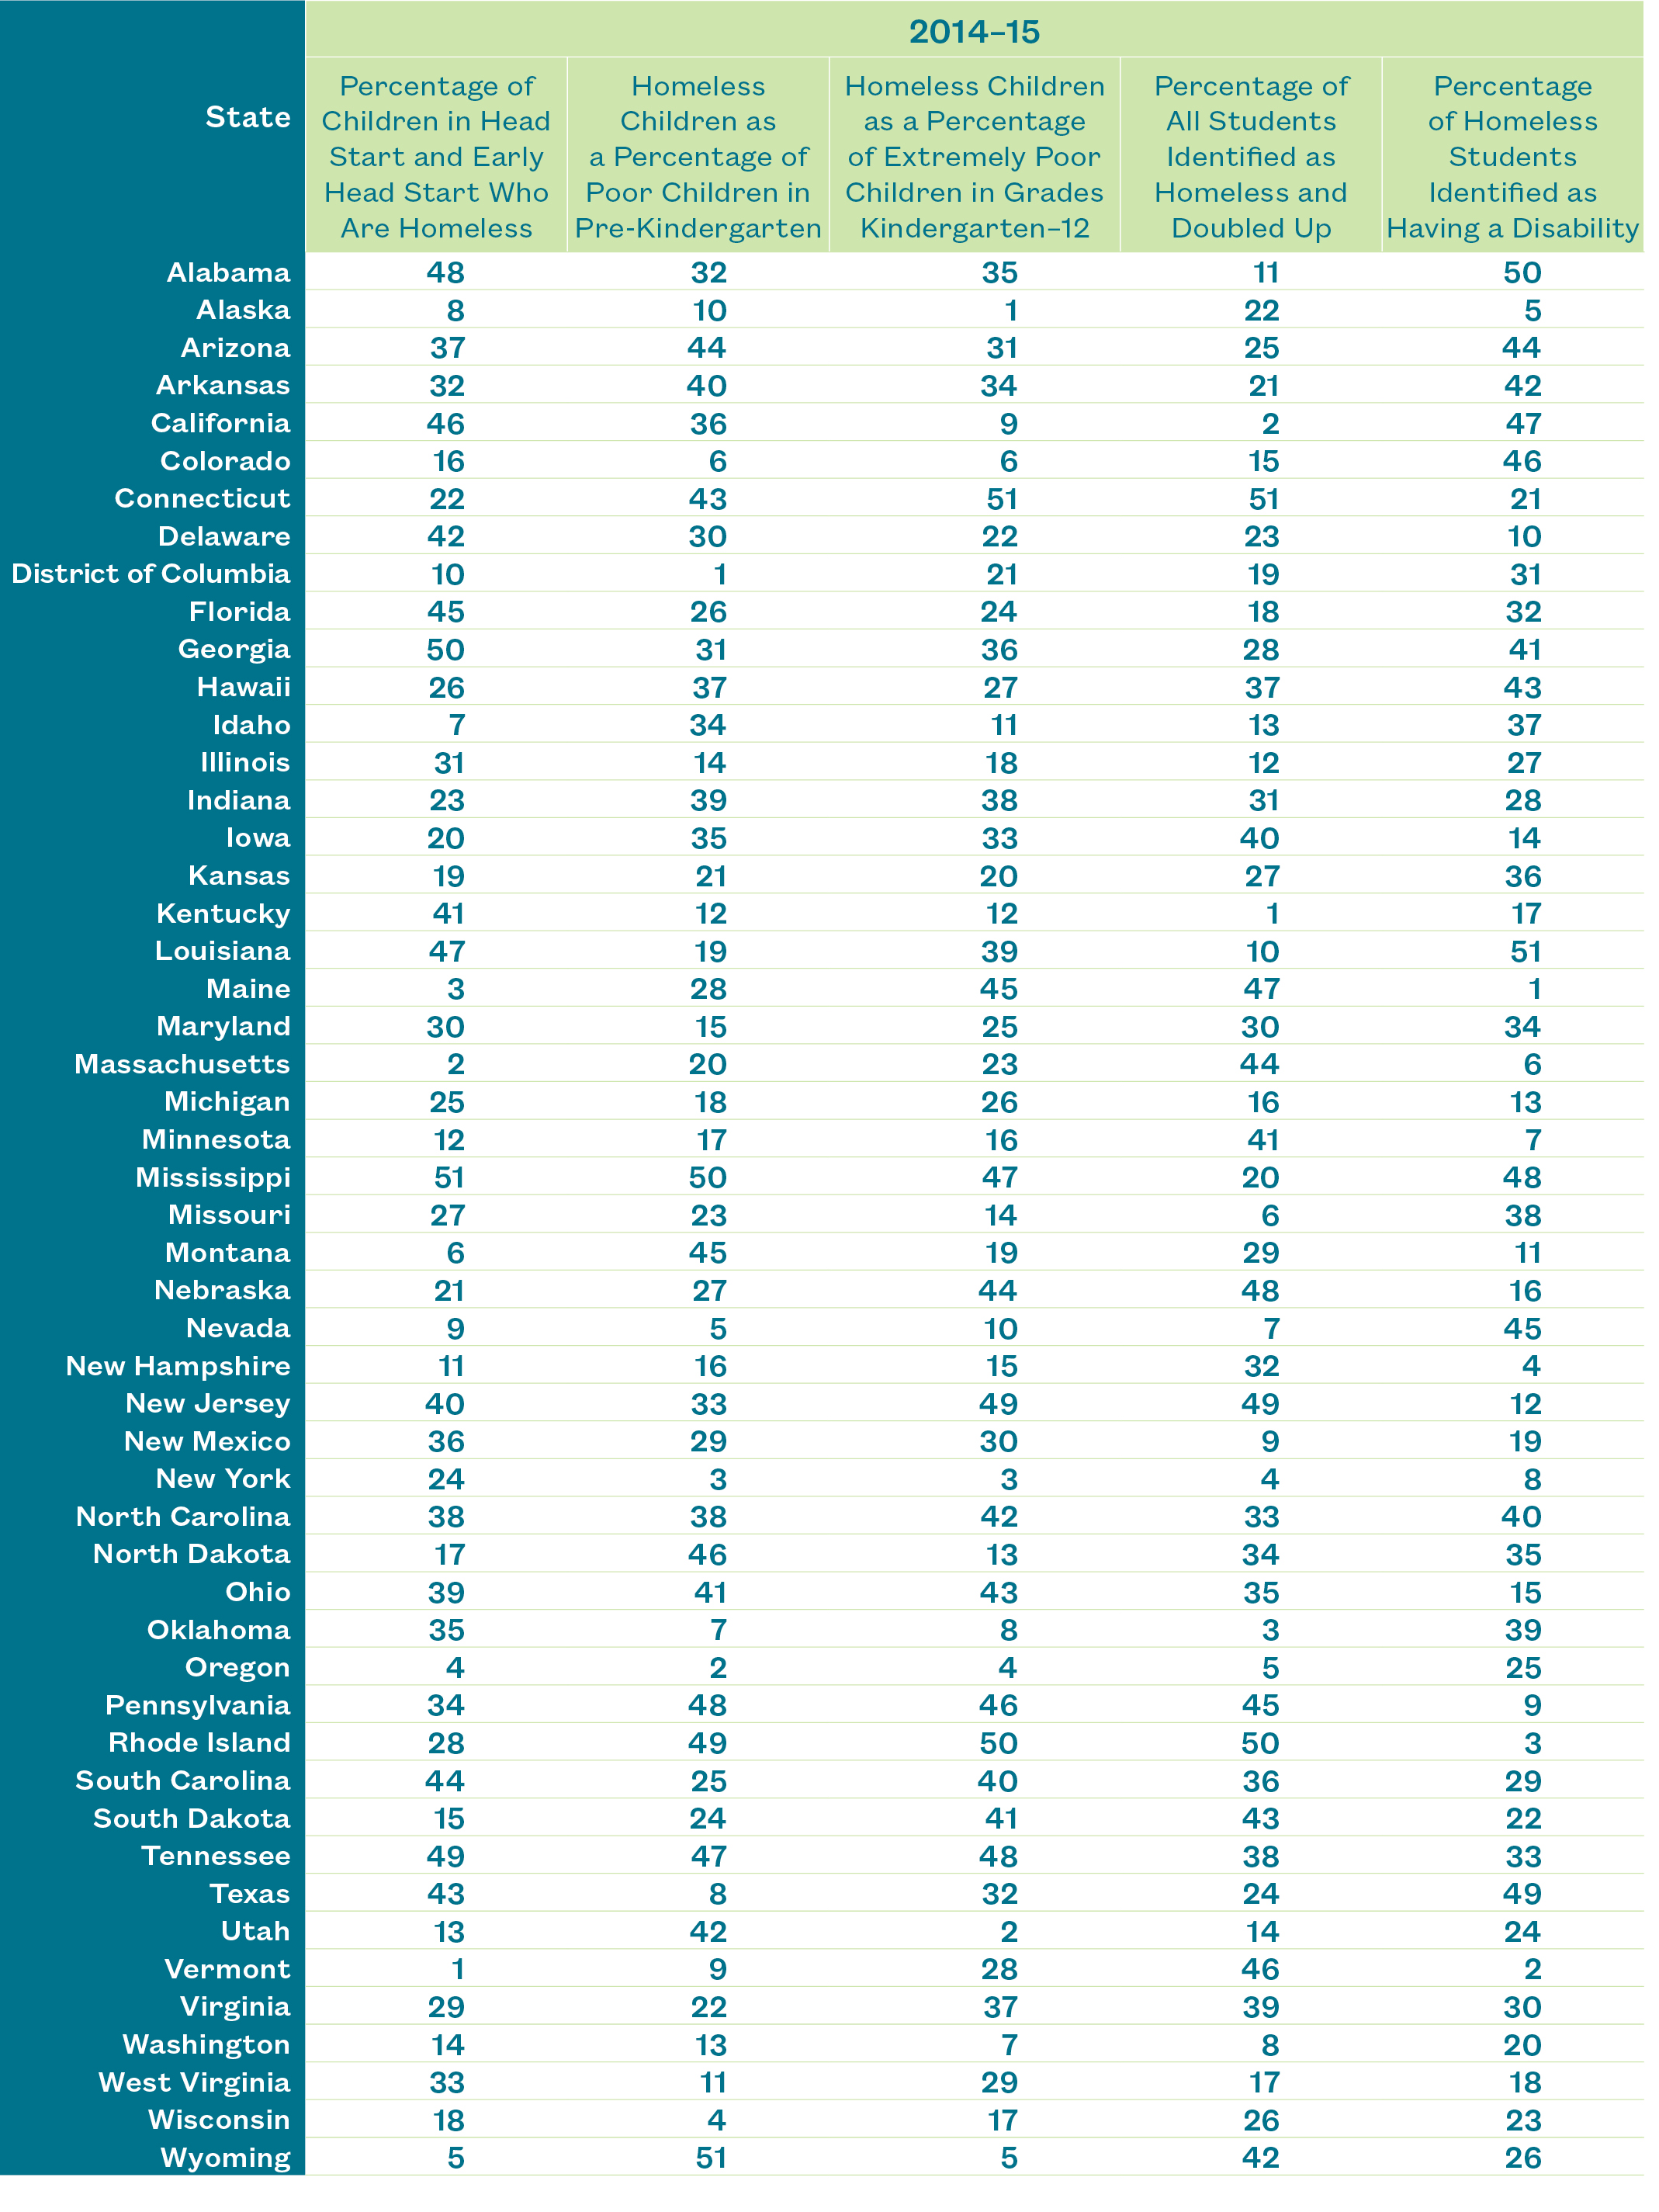
The fifth indicator looks at the percentage of homeless students identified as having a disability. Our student-level work in New York City has shown that many homeless students who have a disability are not identified until well into elementary school—often in third grade as opposed to Kindergarten, the ideal time for disability interventions to begin. This is not to suggest that more homeless children experience a disability than housed students. Rather, because of the transitory nature of homeless families, children are less likely to receive the kind of specific attention required to properly identify a disability and receive an Individualized Education Program (IEP). This measure can allow states to think about how they might ensure that students are properly referred and evaluated in the midst of experiencing homelessness.
We believe these rankings are a starting point for a necessary and valuable conversation about who homeless students are, where they are found, and how we can work together as a nation to support these often hidden, always vulnerable children.
Return to top.
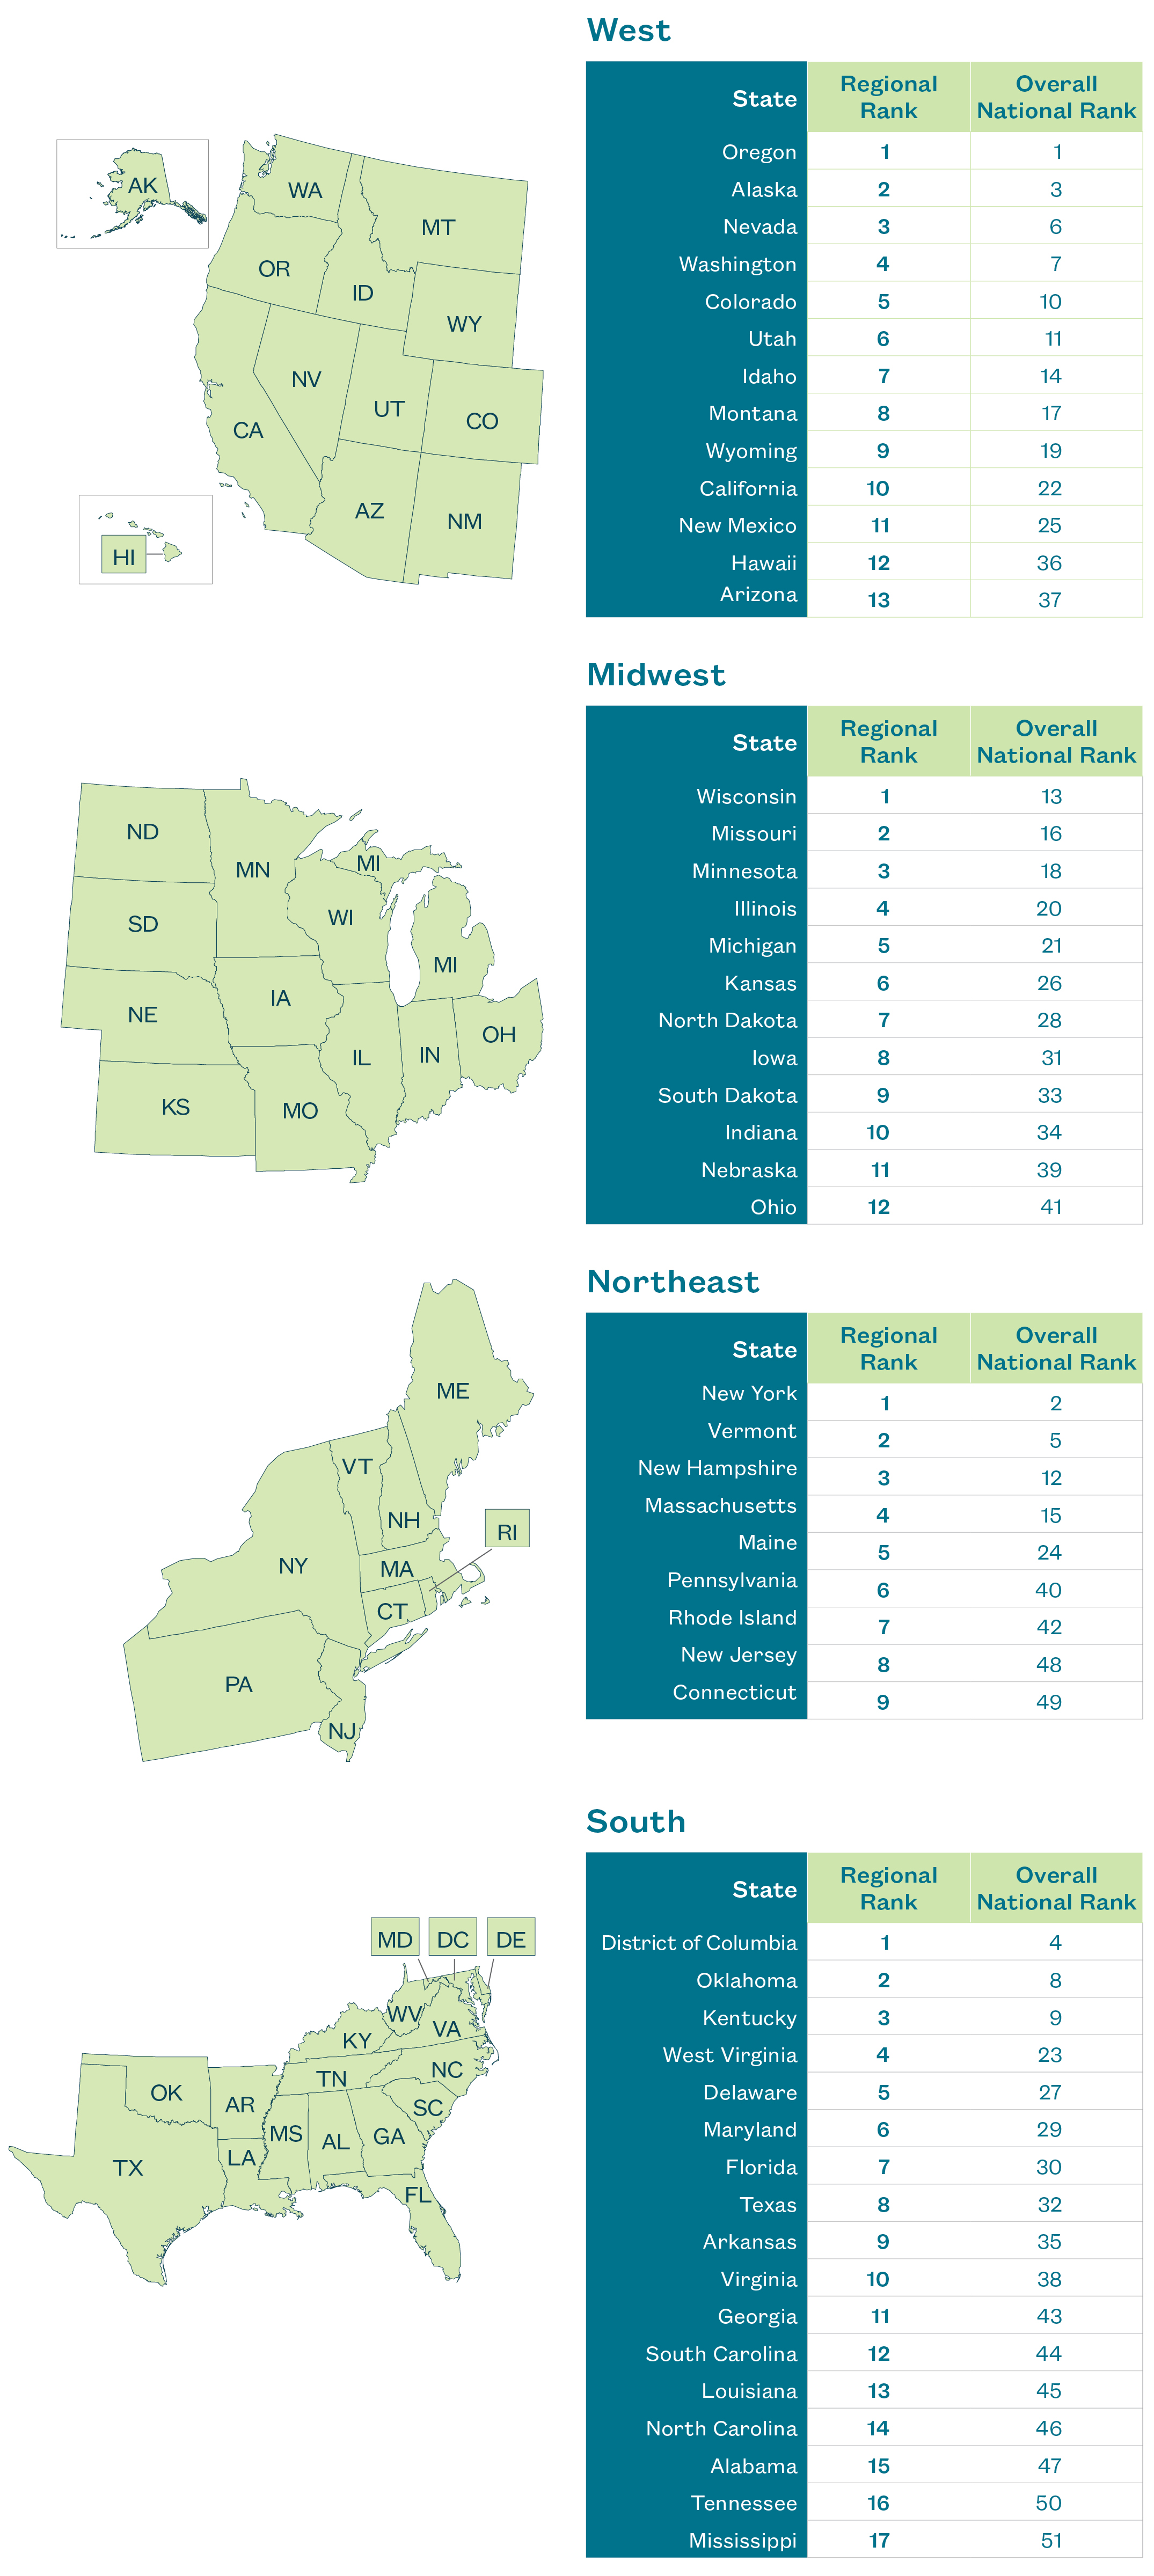
Regional Rankings
Comparing states across the country is important, but we also know that understanding how your immediate neighbors fare in comparison to your state matters greatly as well. Neighboring states are often more likely to share important characteristics when it comes to types of homelessness and available resources, and neighboring states may also have greater opportunities for cross-state partnership than a state on the opposite coast. We chose to present the 50 states and the District of Columbia in four regions—Midwest, Northeast, South, and West.
Return to top.
Homeless Students in Head Start
as an indicator of support and identification
“As toddlers, homeless children frequently begin to demonstrate developmental delays. … Without access to high-quality preschool, low-income and homeless students will be unable to succeed academically on par with students who have had the benefit of early education.”
Large disparities exist in the academic achievement of Kindergarteners who have attended preschool and those who have not. This gap, which can persist throughout a child’s future education, is compounded by the fact that children from low-income families are less likely to attend preschool than their peers. Homeless students are even less likely to attend preschool, despite the fact that early education gives homeless children access to services that can help them overcome some of the negative impacts of homelessness.
The impact of homelessness can be seen in the developmental and academic disparities between housed and homeless students as early as preschool. As toddlers, homeless children frequently begin to demonstrate developmental delays. In fact, three-quarters of preschool-aged homeless children have at least one developmental delay, and almost half have two developmental delays. These delays, which are commonly related to impulsivity and speech, often result in poor educational outcomes.
This indicator focuses on Head Start. The goal, however, is to open the door to a conversation about how states can provide high-quality early childhood education to homeless students and the role that federal funds and federally-regulated programs like Head Start contribute to supporting homeless children.
Ranking states based on their success at providing access to Head Start for homeless children is done by measuring the total number of children experiencing homelessness that were served as a percentage of all children enrolled in the 2015 enrollment year. Helping homeless families both enroll and maintain attendance can be difficult, given these families’ high mobility and unpredictable schedules. States with a higher proportion of homeless children within their total enrollment are more likely to have developed collaborative partnerships between Head Start programs, government agencies, and local shelters that can foster improved access.
Map 3
Percentage of Homeless Children
in Head Start and Early Head Start
Ranked by State, SY 2014–15
Head Start is a federally-funded preschool program that has served over 32 million people since its inception in 1965, and there are currently over 1,700 agencies nationwide that provide Head Start services to low-income families. Since 1998, the mission of Head Start has been to promote school readiness among children in low-income families. At the same time, about 60% of four-year-olds nationwide were not attending publicly-funded preschool in 2015.
In 2015, the Office of Head Start announced new Head Start Performance Standards, to ensure high-quality preschool education across all Head Start programs. The largest change made was that students be in the classroom for a minimum of six hours per day, for 180 days per year (a marked increase from the previous standard with a minimum of three and a half hours per day for 128 days per year). New standards also included improved monitoring of chronic absenteeism, which disproportionately affects homeless students. Importantly, the standards were designed to support the enrollment of homeless children by allowing them to provide immunization records up to 90 days after they start the program. Under the new rules, Head Start providers must also assist homeless families in finding transportation to and from the agency if necessary.
With an increase of over six percentage points, Vermont’s identification of homeless Head Start children saw the most improvement in homeless Head Start enrollment, from 11.1% in SY 2012–13 to 17.2% in SY 2014–15. The percentage of homeless students in Head Start decreased the most in Alaska, where the percent of homeless Head Start students dropped from 11.9% in SY 2012–13 to 9.6% in SY 2014–15. The difference in the percentage of homeless Head Start children between SY 2012–13 and SY 2014–15 was less than one percentage point in the majority of states.
Table 3
Percentage of Children in Head Start
and Early Head Start Who Are Homeless
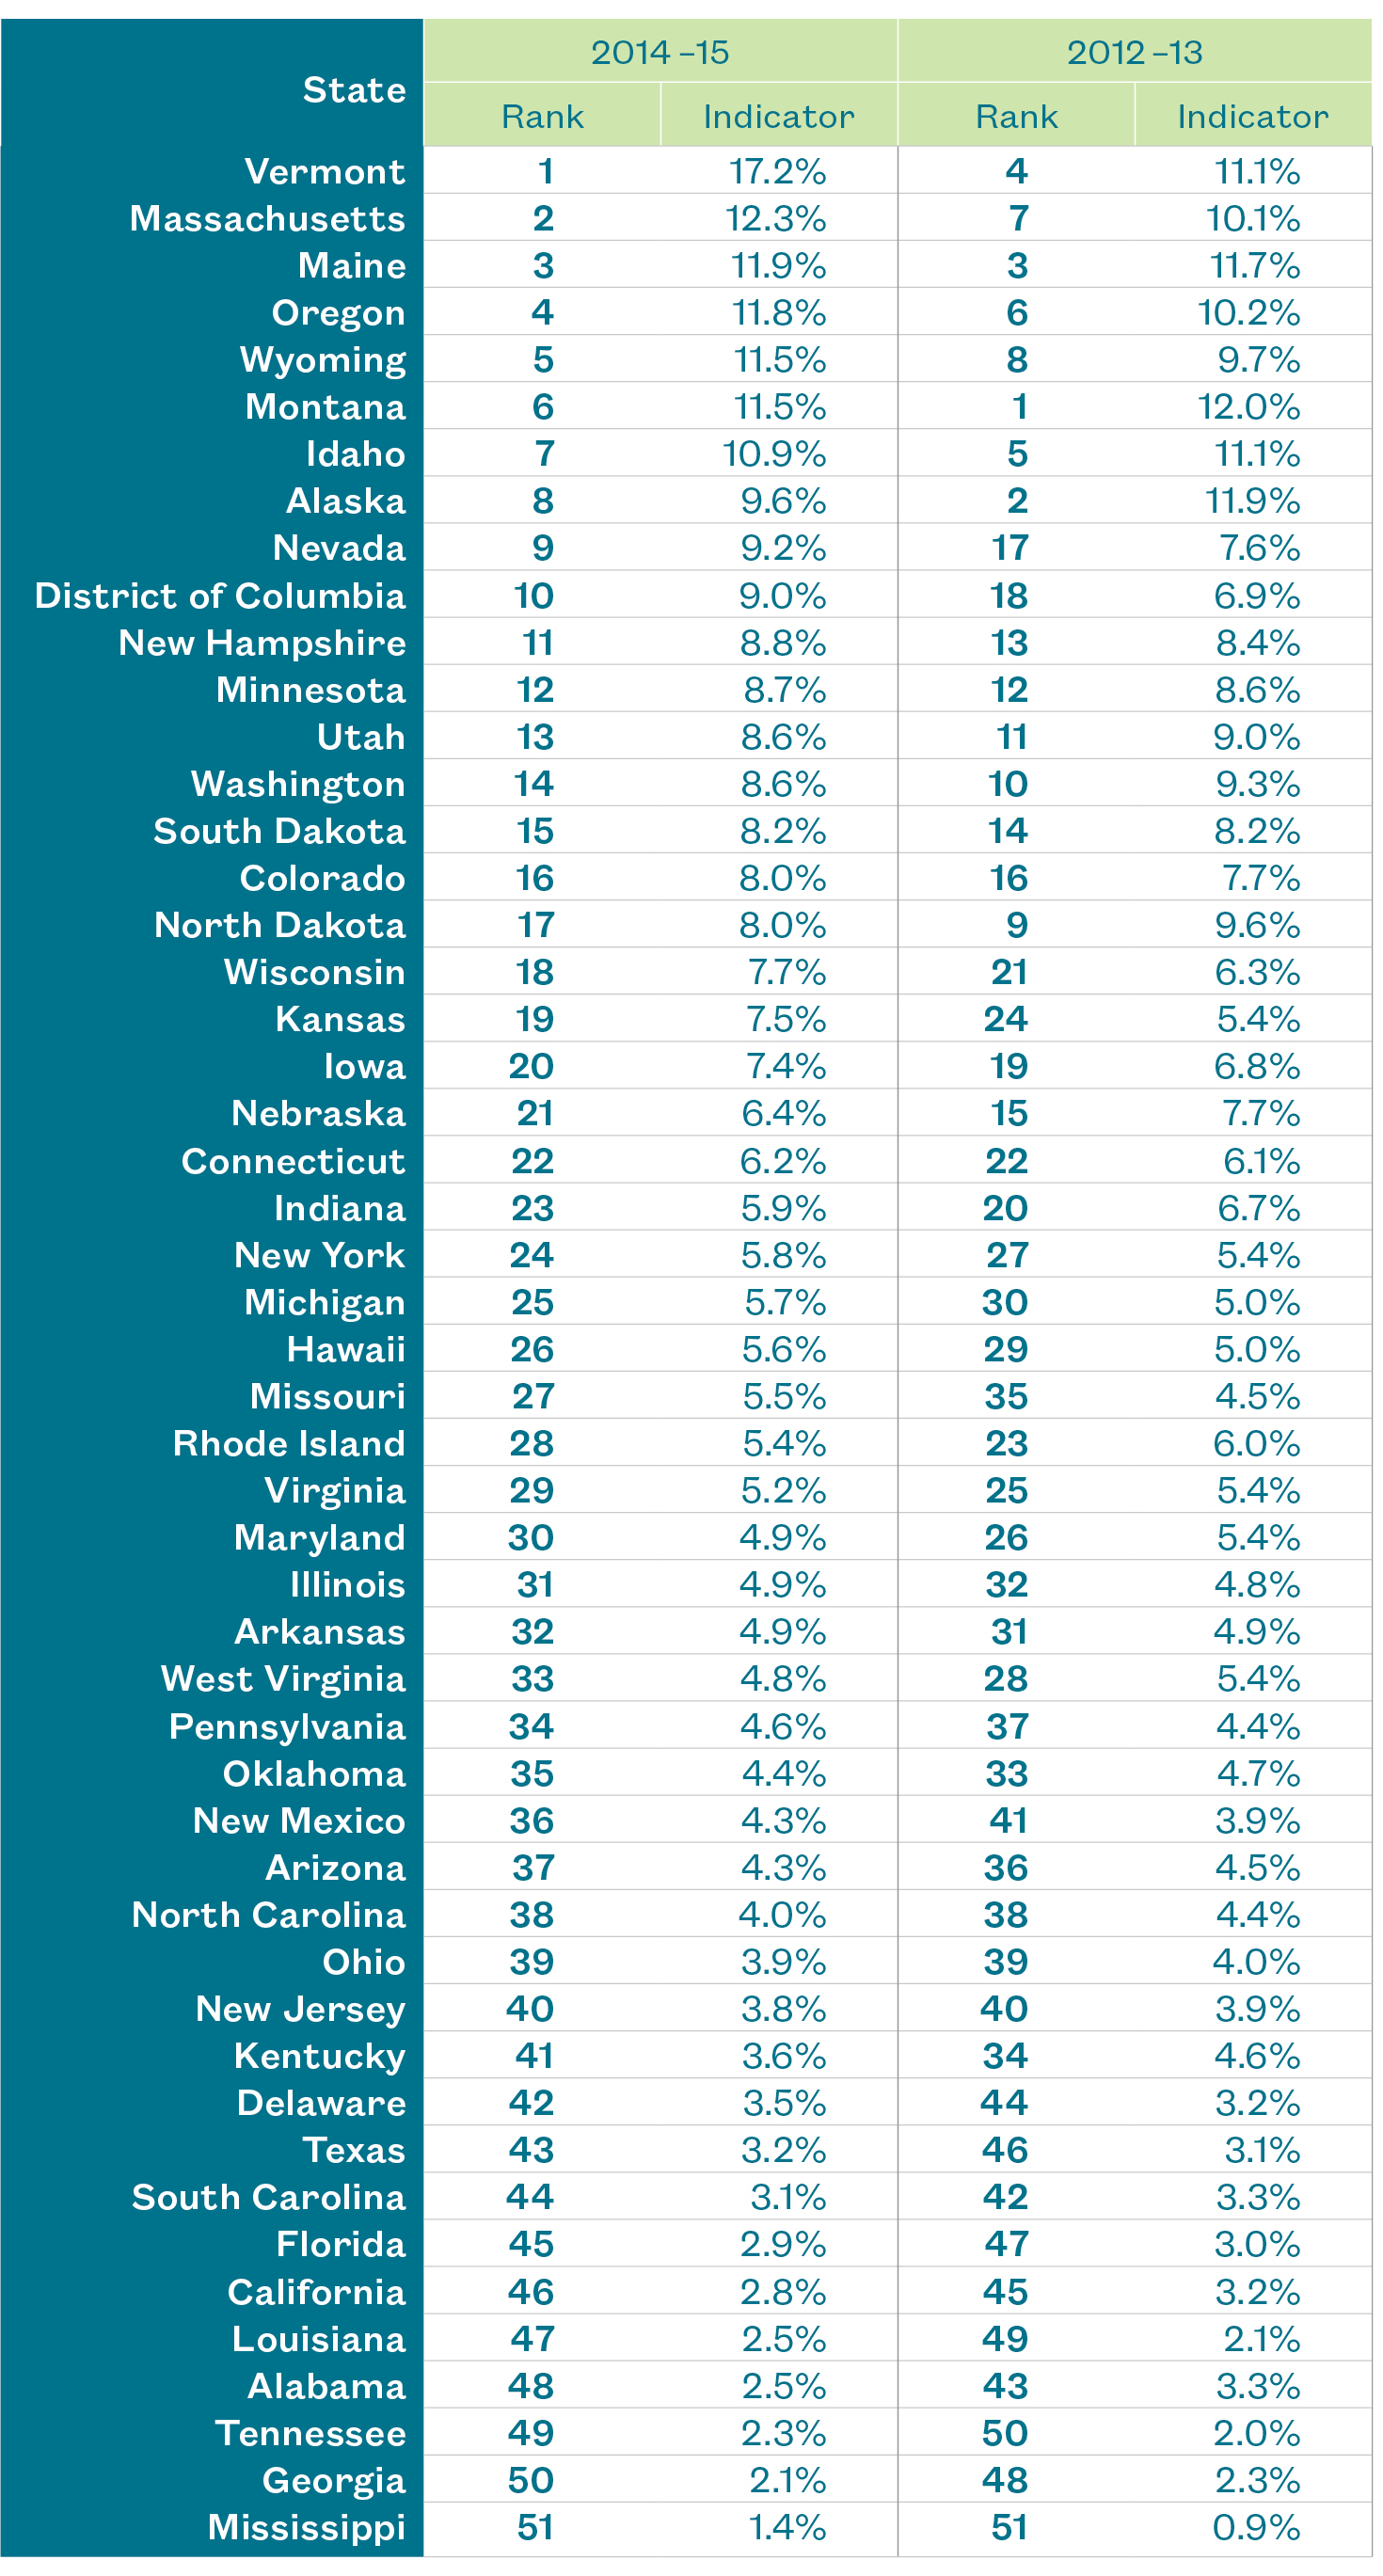
Figure 2
Head Start Federal Funding and Funded Enrollment
FY 2013 to FY 2015
Since 2013, total funding for Head Start increased 10%, to just under $8.3 billion. Over that same period, enrollment increased by 5%, with close to a million children nationwide. Enrollment of homeless children was relatively constant, decreasing slightly from 50,992 children served in 2013 to 50,274 in 2015. This 1% decrease stands in contrast to the 6% increase in homeless three-to-five-year-olds reported by the Department of Education from SY 2012–13 to SY 2014–15.
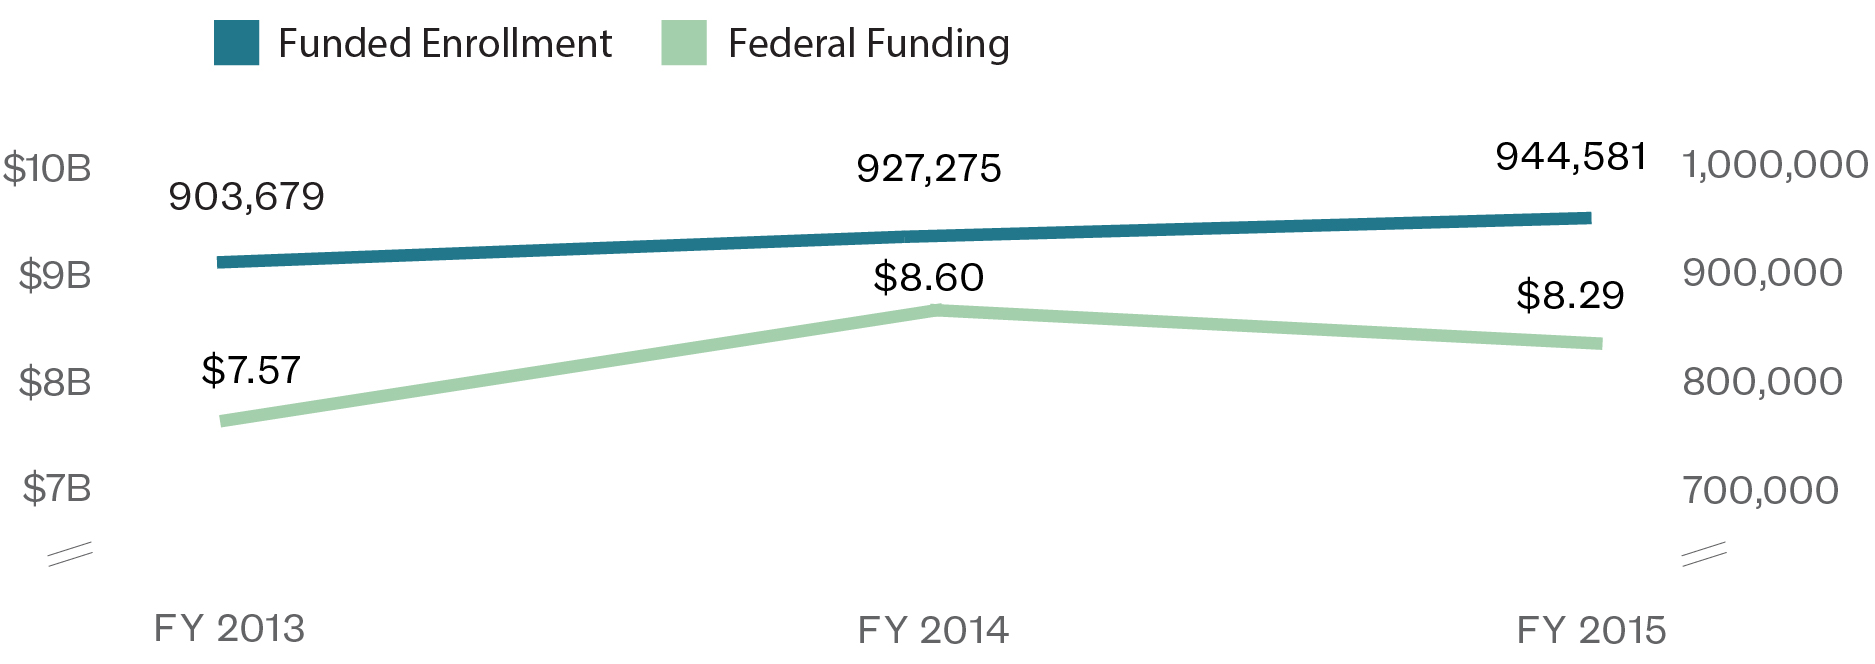
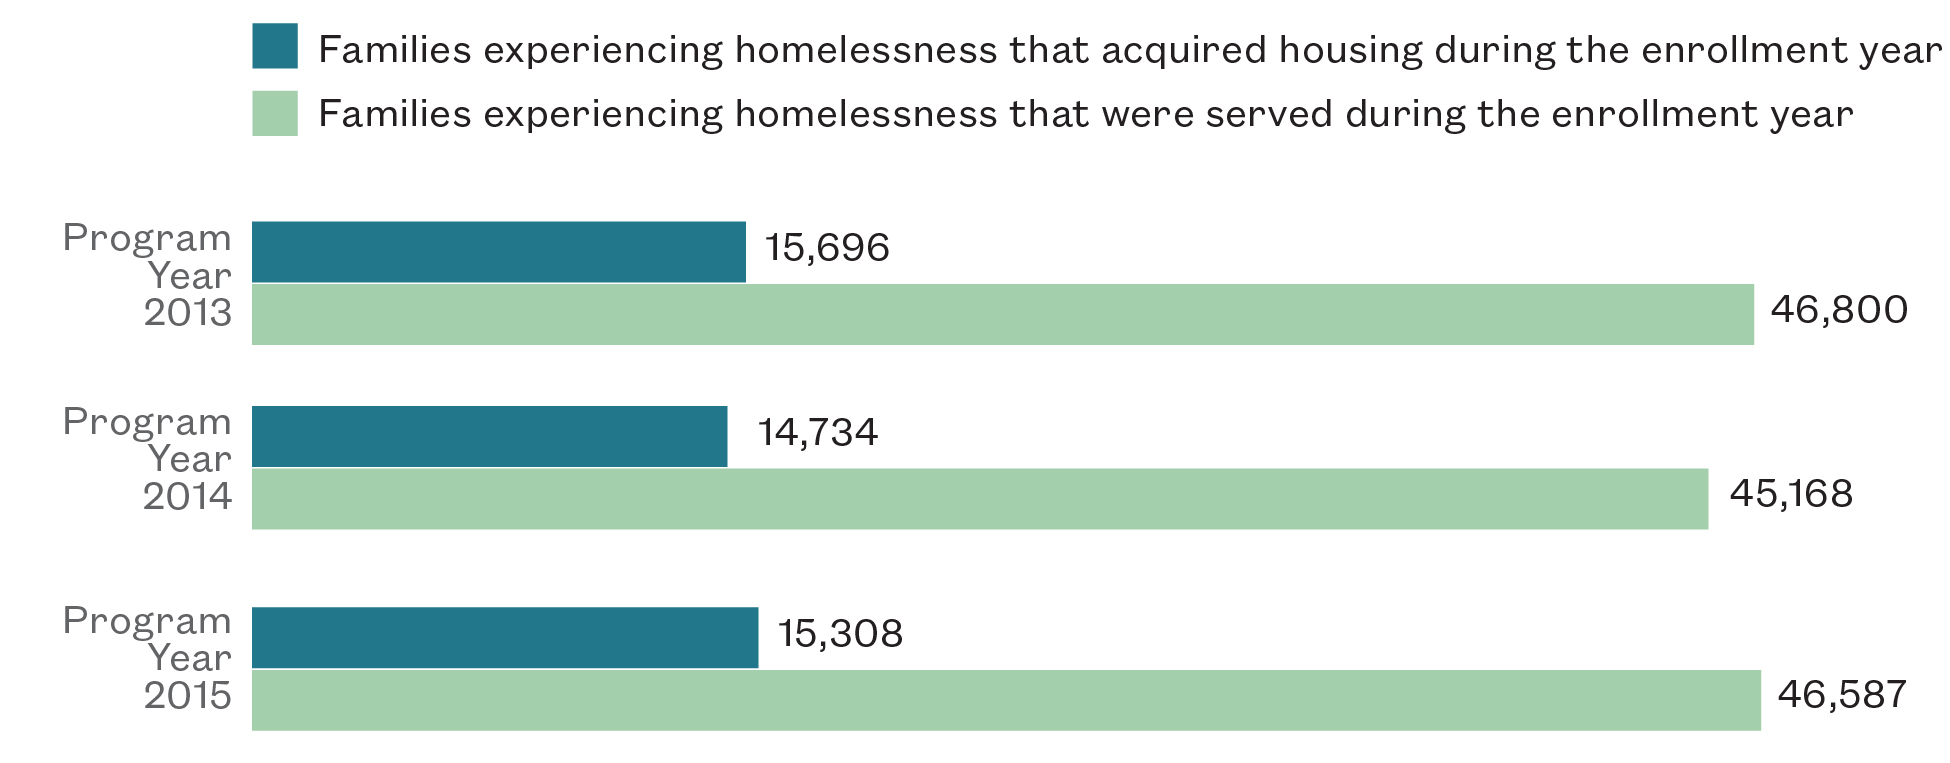
Figure 3
Homeless Families Served by Head Start
Program Year 2013 to FY 2015
From 2013 to 2015, about one-third of homeless families served by Head Start acquired housing during the year. In 2015, the states where Head Start families had the most success finding housing were all located in the Northeast and mid-Atlantic, with over 50% of homeless families in Delaware, Vermont, Massachusetts, and Rhode Island moving into permanent housing during that year. By contrast, several states in the South and West had much lower success rates. In 5 states (Arizona, California, Mississippi, Nevada, and Alabama), less than a quarter of homeless Head Start families were able to acquire housing in 2015.
Spotlight on Vermont
Number one for enrollment of homeless children
in Head Start and Early Head Start
![]()
“We just started providing transportation for our Early Ed kids who are homeless. I think what has been really important is sharing information with the entire district about how to look for clues to the possibility of kids being homeless. If I have all the adults in a building listening for kids talking about where they slept the night before or coming in late and complaining about issues at home, they know to email me a name and I will reach out to the family.”
Mia Marinovich,
Burlington (VT) School District
Vermont has recognized the importance of early childhood education since the 1990s, when the state received a Head Start State Collaboration Grant and the Child Care Development Block Grant. In recent years, the state has taken additional measures to expand preschool access and prioritize homeless children for enrollment, making it the top-ranked state for the enrollment of homeless children in Head Start and Early Head Start for SY 2014–15.
In SY 2014–15, Vermont enrolled 1,720 children in its Head Start programs. Among all enrollees, 295 children, or 17%, were identified as homeless. This percentage was substantially higher than any other state and placed Vermont as an outlier for its success in enrolling homeless children in Head Start programs.
Vermont’s seven Head Start and four Early Head Start programs served 269 homeless families in SY 2014–15. From 2009 to 2015, Vermont improved tremendously compared to the rest of the nation in its ability to identify and enroll homeless children in Head Start. The percent of homeless children enrolled in Vermont’s Head Start programs more than doubled over this time, from 7% in 2009 to 17% in 2015, while the national average of homeless children in Head Start only increased modestly from 3% to 5%.
Vermont has shown innovation in leveraging its resources to expand and strengthen its early education programs. The state’s Head Start programs partner with school districts to offer pre-Kindergarten programs in integrated classrooms and facilities that serve children from different income levels. In SY 2013–14, six Head Start grantees partnered with LEAs at 28 partnership sites, with many classrooms in these sites enrolling both Head Start and non-Head Start children. The partnerships allow Head Start grantees and LEAs to provide individual support to homeless children, share resources, and serve more children.
In 2013, a needs assessment report found low levels of engagement between Head Start grantees and school district homeless liaisons, as well as reports of difficulty experienced by Head Start grantees in implementing family outreach and support services. To address this issue, Vermont’s Agency of Human Services adopted a framework creating an effective continuum of care developed by the state’s Council on Homelessness. Importantly, the framework includes a component for supporting the education of homeless children through coordination between Head Start grantees and homeless liaisons.
Prior to this change, Vermont created Building Bright Futures—its Early Childhood State Advisory Council—one year before all states were charged with creating State Advisory Councils through the Improving Head Start for School Readiness Act of 2007. Building Bright Futures, which is dedicated to coordinating early childhood education programs in the state, was later codified into state law in 2010.
Vermont has also sought additional federal funding to help improve access to preschool. The state was awarded a five-year federal Race to the Top Preschool Development Grant for the expansion of its preschool program from 2015 to 2019. Using funds from this grant and other state and federal sources, Vermont created 176 new preschool slots and improved 183 slots by awarding subgrants to three Head Start programs and 13 other subgrantees.
Spotlight on Nevada
Most improved for serving homeless children in Head Start
“We believe other states could follow in the footsteps of the Clark County School District’s urgency to collaborate with outside entities [although we cannot speak on behalf of the state]. The reauthorization of the McKinney-Vento Act helped to increase the focus on homeless students and their transition to higher education. This has urged the school district, in partnership with the University of Nevada Las Vegas (UNLV) and the Nevada Partnership for Homeless Youth to develop the UNLV HOPE Scholars Program. The program is a collaboration between all three entities to support students, secure year-round housing, academic and financial support while attending UNLV.”
Kelly-Jo Shebeck,
Coordinator, Title I, HOPE, Clark County School District
Nevada’s investment of effort and resources into understanding the needs of early childhood education providers has led to the state’s distinction as the most-improved state for serving homeless children in Head Start. Nevada improved from a rank of 17th in 2013 to 9th in 2015, with homeless children comprising nearly one in ten Head Start enrollees in 2015.
The state has conducted surveys of providers and developed plans to implement their suggestions into early education policy. Nevada has increasingly focused on expanding preschool opportunities to children with high needs, including homeless children, and has taken strides to improve its data systems to track the progress of these students.
In 2015, eleven Nevada grantees provided Head Start, Early Head Start, and American Indian and Alaska Native Head Start programs. From 2013 to 2015, the number of homeless students in Head Start increased by 13%, from 349 students in 2013 to 395 in 2015. Meanwhile, total enrollment of children in Nevada’s Head Start programs dropped by 7%, from 4,586 in 2013 to 4,280 in 2015 (the drop in total enrollment was partially due to sequestration cuts).
Despite funding cuts, Nevada has maintained its commitment to providing preschool education to homeless children. The state conducted a needs assessment in 2013 to understand what resources Head Start and Early Head Start grantees need to effectively serve students. Of the eight grantees that responded, three reported having no working relationship with a McKinney-Vento homeless liaison and three reported having no working relationship with housing agencies and groups serving homeless families. Moreover, five grantees reported having at least some difficulty in obtaining data on the needs of homeless children.
In response, Nevada’s Head Start Collaboration Strategic Plan includes the goal of increasing communication and enhancing relationships between Head Start agencies and other service providers to expand outreach to eligible families, including the families of homeless children. Additionally, Nevada’s Early Childhood Comprehensive System Strategic Plan for 2014–2017 aims to improve the state’s data collection system by linking child-level demographic and developmental data with program site information to monitor the effectiveness of early childhood education programs.
Nevada has also implemented improvements to its early childhood education system through the legislative process. The state passed Nevada Assembly Bill 79 in 2013, which placed its Early Childhood Advisory Council into law. The Council went beyond the requirements of the Improving Head Start for School Readiness Act of 2007 by supporting a provision for a mental health assessment for young preschool children. This led to the state allocating additional funding to southern Nevada to increase mental health services to children. In addition, the Council supported the establishment of the Tribal Early Childhood Advisory Council to spread awareness about the importance of early childhood education among tribal communities.
These advancements are important for homeless children who are often at higher risk for mental health issues. In addition, the creation of the Tribal Early Childhood Advisory Council is expected to result in higher enrollment rates in Head Start for children from tribal communities. This is critical, given that Nevada did not receive any American Indian/Alaska Native Head Start funding for Early Head Start in 2015.
Nevada also aligned and consolidated several early childhood programs into the recently-established Office of Early Learning and Development in the Department of Education. The Office administers funding from the Head Start State Collaboration Office Grant and the Pre-Kindergarten Development Grant, among others. In 2014, the federal government awarded Nevada a four-year federal Preschool Development Grant. Nevada received approximately $6.4 million in FY 2014 and $7.2 million in FY 2015, but did not allocate funding until legislative approval in June 2015. The state has already begun to use the grant funds to expand preschool access to five high-needs counties by partnering with Head Start grantees, as well as LEAs and non-profit organizations.
Return to top.
Homeless Students in Pre-Kindergarten
as an indicator of support and identification
“Despite improved laws and an overall trend toward expansion of state pre-Kindergarten programs, many homeless children can still lack access to a quality early education. … Homeless students can be subject to long waiting lists for pre-Kindergarten if they are not prioritized for enrollment under state law.”
Achievement gaps start even before children walk into their first day of school—children who start school with early math and reading skills are more likely to achieve academically in later years. Pre-Kindergarten is now recognized as a crucial building block for ensuring school readiness for all children, and especially for homeless children. Indeed, there is significant evidence to support the idea that pre-Kindergarten benefits children across race, ethnicity, and class. Forty-three states and the District of Columbia use state funds to support early childhood education such as pre-Kindergarten; approximately 1.4 million four-year olds attended a state-funded preschool program in 2015, of which over 39,000 were homeless.
State pre-Kindergarten programs are similar to Head Start in that they provide education to young children in low-income families. While Head Start has federally-mandated standards, state pre-Kindergarten programs can vary in their eligibility requirements, funding, quality, and services provided. The potential impact of such variations on homeless students was reduced, however, under revisions to McKinney-Vento passed as part of ESSA.
Under the new law, preschool/pre-Kindergarten programs are now included in the definition of a student’s “school of origin,” entitling homeless pre-Kindergarten students to the funded transportation homeless Kindergarten-grade 12 students had been previously guaranteed. Additionally, ESSA requires school districts to review their policies and eliminate barriers that may prevent homeless children from receiving the same quality education as their housed peers.
These additional protections for young homeless children come as many cities and states are realizing the positive effects of providing pre-Kindergarten education to low-income children. Total state funding of pre-Kindergarten rose to almost $7.4 billion in 2015–2016, and average state spending per child in pre-Kindergarten increased to $4,976.
Despite improved laws and an overall trend toward expansion of state pre-Kindergarten programs, many homeless children may still lack access to a quality early education. A homeless child’s access to preschool varies greatly depending upon the local pre-Kindergarten eligibility criteria, the number of slots available in state pre-Kindergarten programs, and local financial resources. Homeless students can be subject to long waiting lists for pre-Kindergarten if they are not prioritized for enrollment under state law. Additionally, although ESSA states that lack of medical records or birth certificates should not prevent a child from being enrolled, many preschool programs continue to follow state and local documentation requirements for enrollment, and may not be aware of the new federal policy.
Ranking states on how well they are able to identify and enroll homeless students in their pre-Kindergarten programs requires more than counting the number of preschool-aged homeless children. By measuring the ratio of homeless students enrolled in preschool to poor children (children in families earning less than the federal poverty level) in preschool, it is possible to control for varying levels of poverty in different states. Two states may have an identical number of homeless children enrolled in pre-Kindergarten, but the state in which homeless children make up a smaller percentage of those in poverty is more likely to be under-identifying or under-enrolling its homeless students.
For SY 2014–15, the District of Columbia earned the top rank by having the highest ratio of homeless pre-Kindergarten students to poor children, at 19.6%, making it the top-ranked state on this indicator. Since SY 2012–13, Vermont had the largest percentage point increase in this indicator, a likely result of a 2014 law implementing universal pre-Kindergarten. By virtue of a relatively strong performance in SY 2012–13, however, Vermont did not improve by as many rankings as Maine, which climbed 14 places to 28th among all states in SY 2014–15.
Map 4
Homeless Children as a Percentage of Poor Children
in Pre-Kindergarten
Ranked by State, SY 2014–15
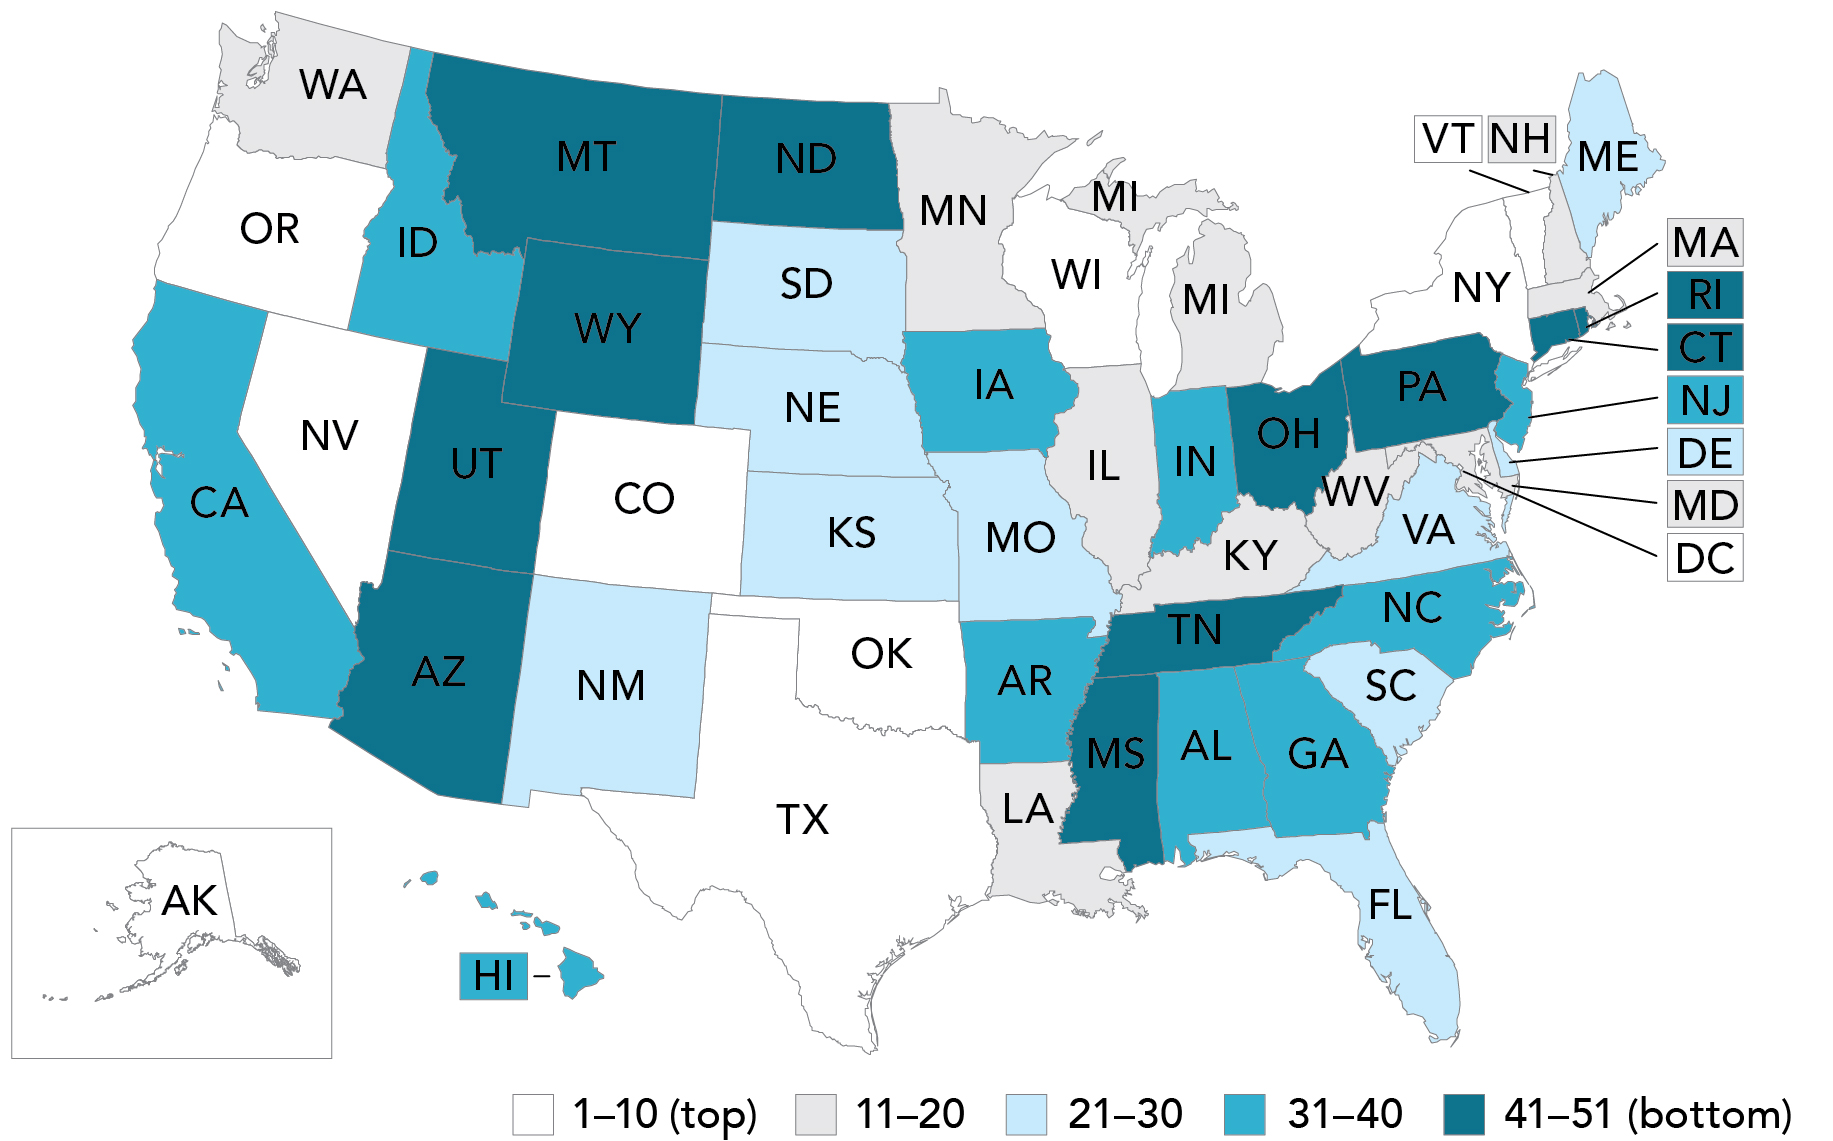
Table 4
Homeless Children as a Percent of Poor Children
in Pre-Kindergarten
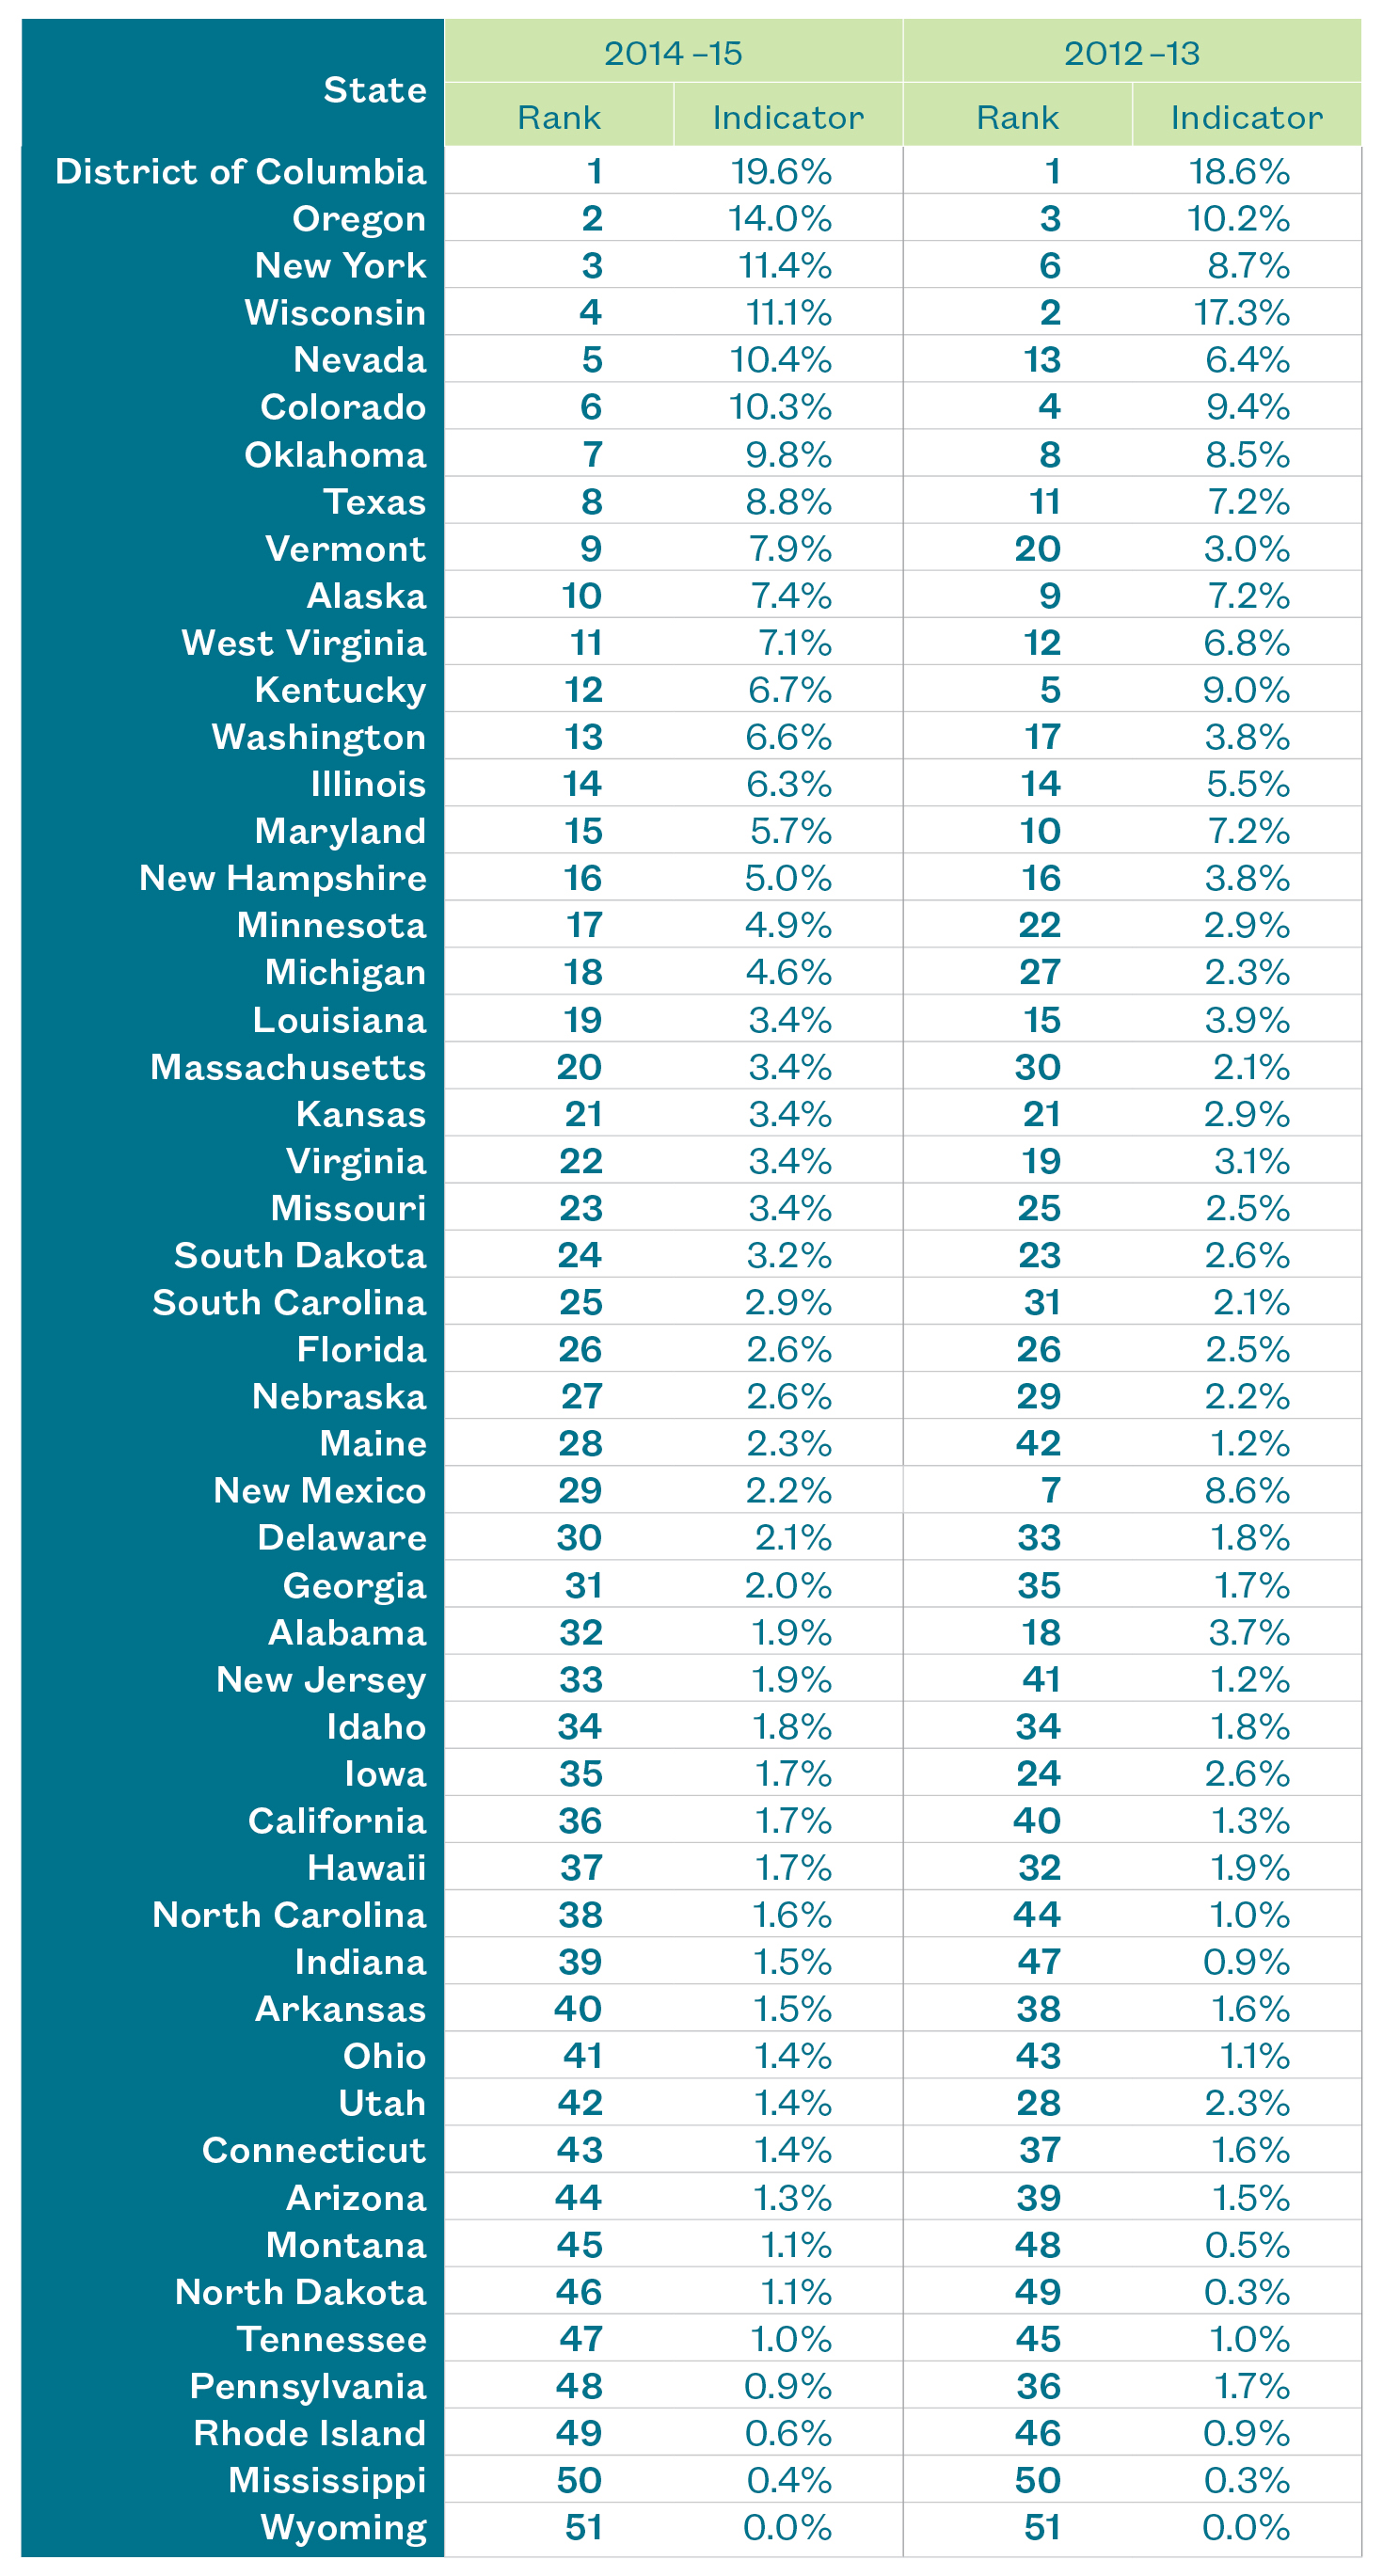
Figure 4
States with Highest and Lowest Spending
on Pre-Kindergarten
SY 2015–16, per enrolled child
To expand access to quality preschool programs, most states fund their own pre-Kindergarten programs in addition to serving preschool-aged children through Head Start. Nationally, the average state spending per enrolled child was $4,521. The states that spent the most per child in pre-Kindergarten in 2015 were, with the exception of Oregon, located on the East Coast. The District of Columbia spent the most on each student in pre-Kindergarten, spending an average of $16,431 per enrolled child. The states that spent the least per enrolled child in their pre-Kindergarten programs were generally located in the Midwest and the South. With an average spending of $1,778 per enrolled child in 2015, Mississippi spent the least per pre-Kindergarten student.
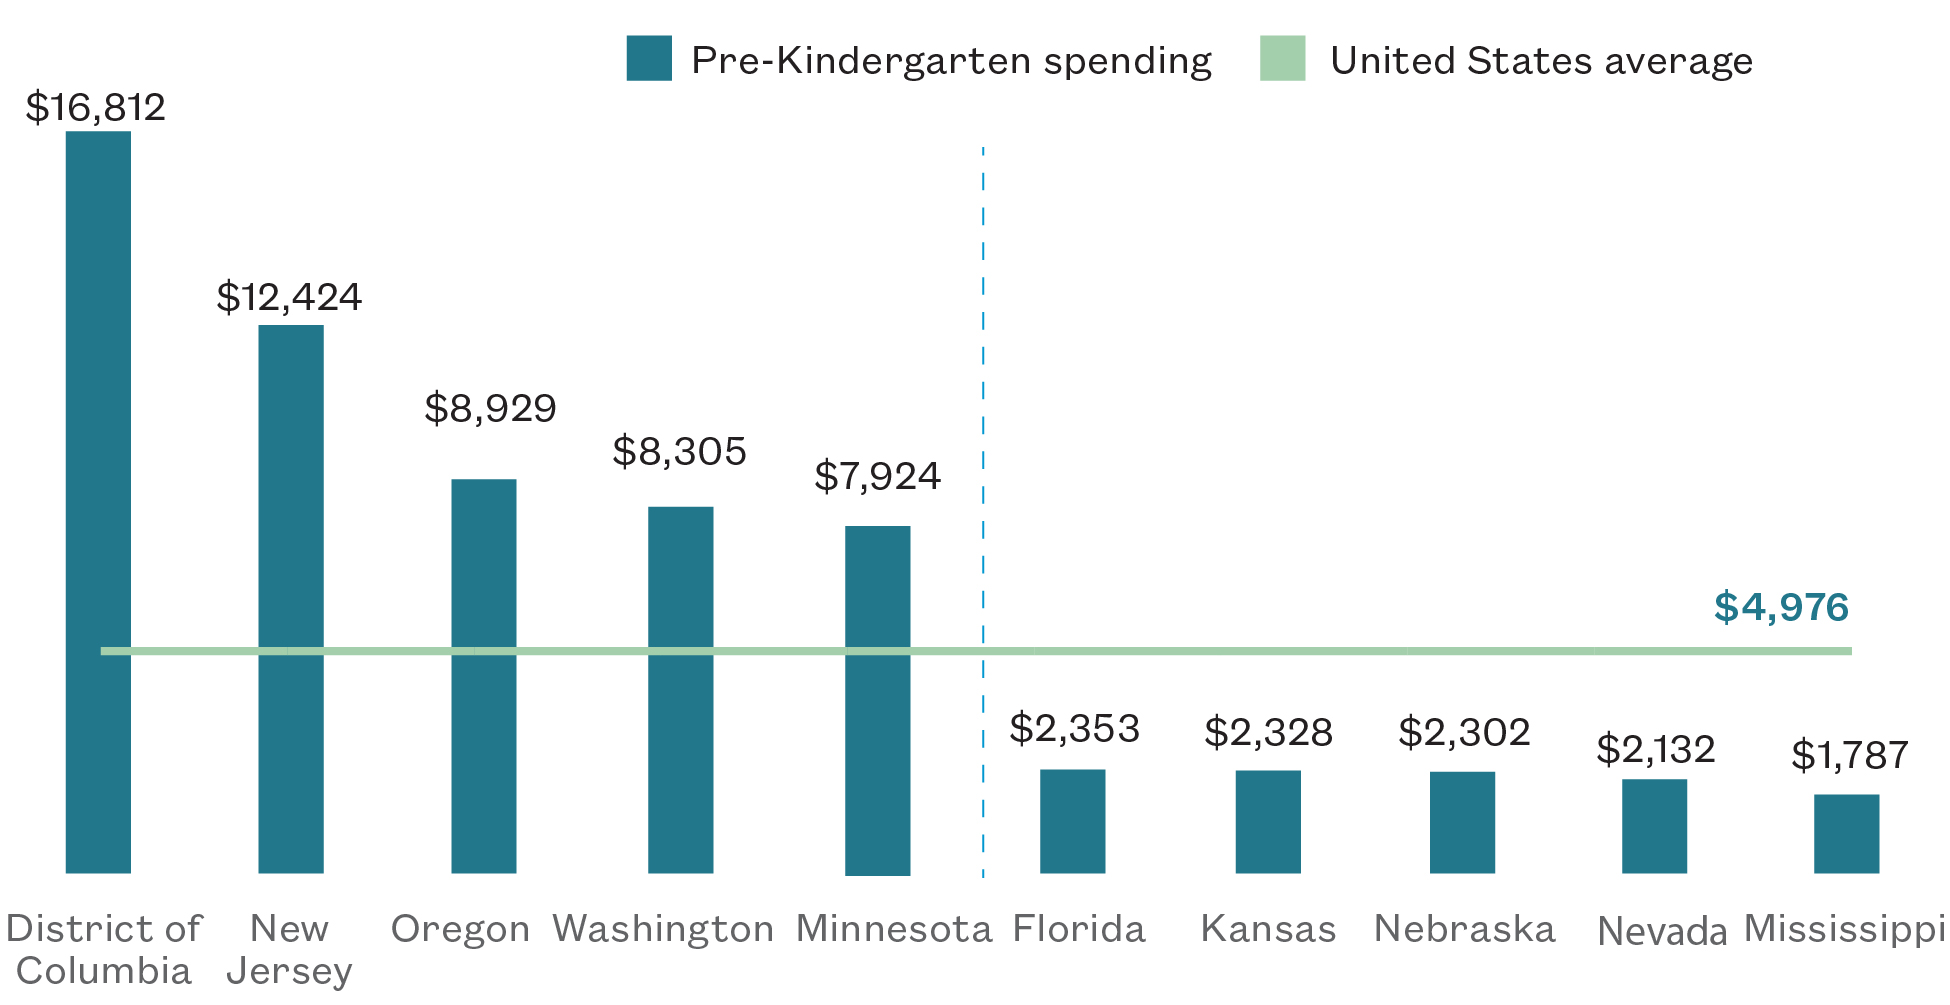
Figure 5
Number of States that Use Risk Factors
Besides Income to Determine Eligibility
for State Pre-Kindergarten Programs
SY 2014–15
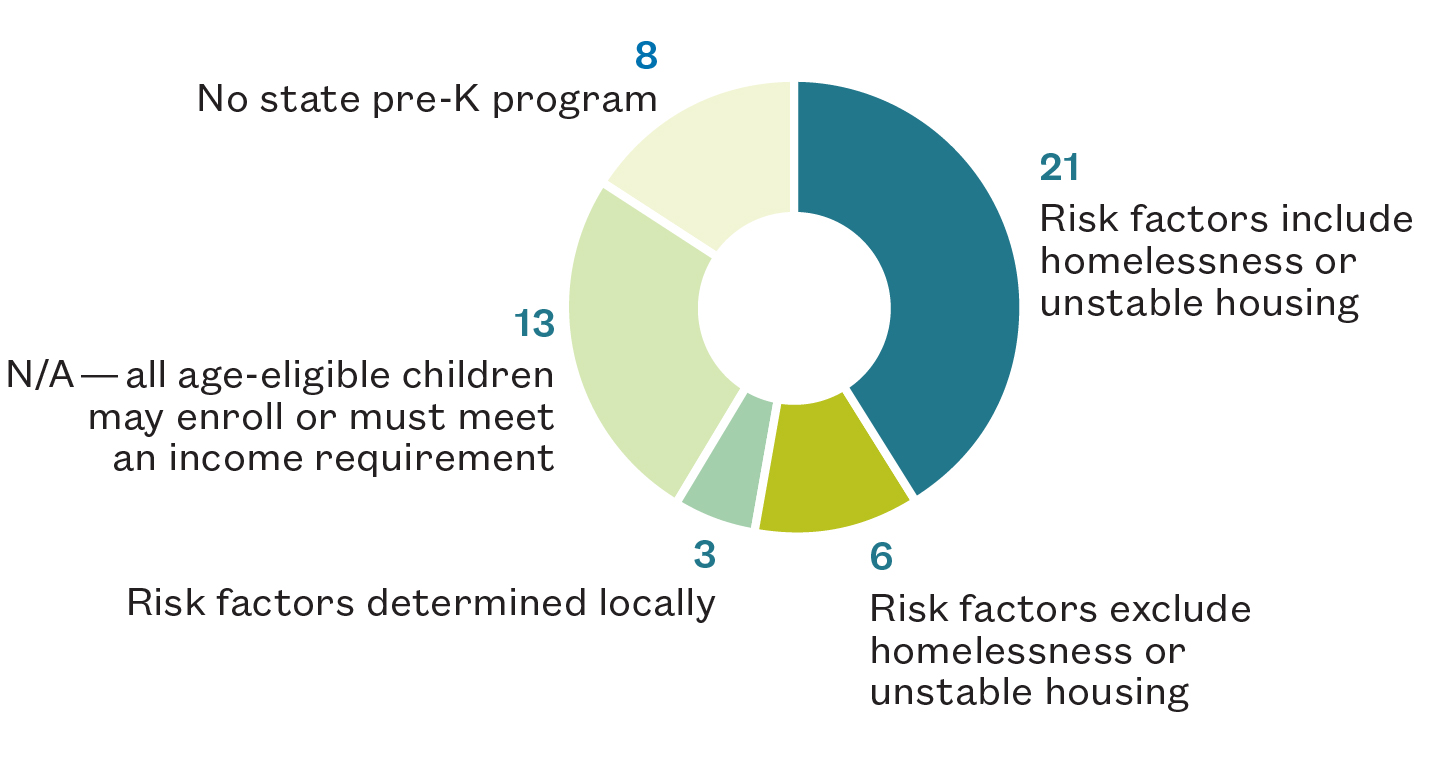
In 2015, 42 states and the District of Columbia invested state funds into pre-Kindergarten programs. In addition to the use of a family’s income level to determine eligibility, 30 states identified other risk factors that could qualify children for state-run programs. Of all states with pre-Kindergarten programs, almost half included homelessness or unstable housing as a factor that could be used to deem children eligible for their state pre-Kindergarten programs. The six states that neither had universal or income-only eligibility nor included homelessness as a risk factor were Hawaii, Kansas, Nebraska, New York, North Carolina, and West Virginia.
Return to top.
Spotlight on District of Columbia
Number one in identification and enrollment
of homeless pre-Kindergarteners
“The accessibility of D.C.’s universal pre-Kindergarten program has led to the District being ranked first in the identification and enrollment of homeless pre-Kindergarteners.”
The District of Columbia has been committed to pre-Kindergarten programs for its children for decades, with homeless students representing a high percentage of children served. The accessibility of D.C.’s universal pre-Kindergarten program has led to the District being ranked first in the identification and enrollment of homeless pre-Kindergarteners. In SY 2014–15, homeless children aged 3–5 constituted 19.6% of D.C.’s poor children enrolled in pre-Kindergarten. Thirteen states had larger numbers of homeless pre-Kindergarten aged children, but their lower ratios of homeless students to children living in poverty suggests that there are still homeless children that are not being reached in these states.
D.C. has been investing in pre-Kindergarten programs since 1960, and started providing universal pre-Kindergarten in 2008 through the Pre-Kindergarten Enhancement and Expansion Amendment Act. The Act determined class size, set curriculum standards and teacher qualifications, and required that there be universal pre-Kindergarten in the District by 2014. In 2015, the program reached 64% of all three-year-olds and 86% of four-year-olds in the District, providing an early childhood education to a greater proportion of the preschool-aged population than any other state.
The District of Columbia runs pre-Kindergarten programs through its public schools, public charter schools, and community-based organizations. Pre-Kindergarten programs implemented in District of Columbia Public Schools Early Childhood classrooms follow several models of academic programming. In order to ensure high-quality early education among D.C. Public Charter Schools, the Early Childhood Performance Management Framework is used as an accountability measure. The framework mandates that early childhood programs be scored annually on outcomes such as student progress, teacher interaction using the Classroom Assessment Scoring System (CLASS), and attendance. Other organizations administering pre-Kindergarten also collect CLASS data to ensure high-quality programs. All public pre-Kindergarten programs in the District are full-day programs, which is extremely helpful to parents who may be looking for housing or work, are working long hours to make ends meet, or cannot afford childcare.
In order to enroll in D.C.’s pre-Kindergarten program, parents first fill out the “My School DC” common application. As part of the application process, parents select up to 12 pre-Kindergarten programs in which they would like their child to be enrolled. Afterwards, there is a citywide random lottery to determine where the child will be placed. According to the Pre-Kindergarten Enhancement and Expansion Amendment Act, proof of residency must be established in order to enroll the child in D.C.’s universal pre-Kindergarten program. If, however, the parents of homeless students cannot provide proof of D.C. residency, children can still be enrolled if the school district’s homeless liaison provides a homeless referral to the Office of the State Superintendent of Education.
Return to top.
Spotlight on Maine
Most improved for serving homeless pre-Kindergarteners
Maine has taken great strides to expand access to pre-Kindergarten, rising 14 spots since our previous ranking to go from 42nd to 28th for this indicator. The state established the Public Preschool Program for four-year-olds, the funds for which are distributed directly to the state’s school administrative units, or school districts. In SY 2014–15, 88% of school districts had a Public Preschool Program. Districts have formal partnerships with a regional Head Start grantee to provide full-day, full-week programming with wrap-around services. This program design is especially beneficial to homeless and low-income families, as these parents may not be able to provide transportation for the child or afford childcare during the day.
In SY 2012–13, 1.2% of poor preschool students in the state were identified as homeless, while 2.3% of poor preschool students were homeless in SY 2014–15. The number of homeless pre-Kindergarten students increased slightly, while the number of poor pre-Kindergarten students in the state decreased by 23%, from 2,118 to 1,625. Over this period, the state undertook several legislative and administrative actions to improve Maine’s ability to serve more poor and homeless students in its pre-Kindergarten programs in the years to follow.
In 2013, the State Agencies Interdepartmental Early Learning Team was created to ensure interagency coordination in reforming early education between the Department of Education and the Department of Health and Human Services. The Maine Department of Education was awarded a federal Preschool Expansion Grant for $14.8 million in 2014. This grant creates pre-Kindergarten programs in the 13 school districts with the highest percentages of low-income students over the course of four years. In all of the school districts that are receiving funds, over half of their elementary school students qualify for free- or reduced-price lunch. By the end of the fourth year of the grant, Maine will have created 33 new classrooms and will have expanded 23.
The Maine Legislature passed an act in 2014 requiring that each school district provide a publicly-funded preschool program by the 2018–19 school year. This law will vastly improve accessibility to pre-Kindergarten for homeless and low-income children, who may live in currently underserved areas. The percentage of the state’s four-year-olds enrolled in pre-Kindergarten has been steadily increasing, with 36% of all four-year-olds enrolled in state pre-Kindergarten in 2015. In 2015, Maine revised and replaced their State of Maine Early Childhood Learning Guidelines, creating Maine’s Early Learning and Development Standards. Early childhood education in Maine is not only becoming accessible to all children, but all programs will be held to the same high-quality standard.
Return to top.
Homeless Students
in Kindergarten–Grade 12
as an indicator of support and identification
“Without proper interventions, homeless students are at risk for a number of adverse outcomes. These students often lack stability in their lives, moving from place to place as their families exhaust housing options.”
The first step to serving homeless students is identification, in which teachers and school officials make a concerted effort to determine which students are facing homelessness and provide them with the appropriate resources. Across all states, 30% of extremely poor children were identified as homeless in SY 2014–15. This represents an increase from 27% in SY 2012–13. States varied considerably in their ability to identify homeless students, with Alaska, Utah, and New York each identifying greater than 50% of extremely poor students as homeless in SY 2014–15, but Connecticut and Rhode Island each identifying fewer than 10%.
In order to assess how well states identify homeless Kindergarten–12 students, this indicator gives a ratio of the number of homeless children in these grades to the number of extremely poor children (children whose families earn less than 50% of the federal poverty level). The number of extremely poor children is used as a benchmark since we do not know the true number of homeless students, but it is assumed that unidentified homeless students live in each state. Therefore, states that moved up in the ranking identified a greater proportion of their extremely poor students as homeless in 2015 compared to 2013.
Homeless students often lack stability in their lives, moving from place to place as their families exhaust housing options. This leads to frequent changes in school for students and puts homeless students on the high end of a continuum of risk factors that can lead to poor academic achievement, as well as behavioral and health problems. The federal government has recognized the risks associated with child and youth homelessness and has enacted policies intended to provide homeless students with educational opportunities equal to those given to housed students. Identification is crucial in enabling homeless students to access these services and resources.
ED provides funding for homeless students to states through formula grants based on the number and percentage of children from low-income families within the Local Education Agencies (LEAs) in each state. In turn, most states are required to distribute at least 75% of federal funds to LEAs through a competitive grant process. States use the retained portion to create a position for a state coordinator for homeless education. LEAs use these funds to appoint and train a homeless liaison and provide transportation for homeless students to and from their school of origin, among other uses.
Providing regular trainings for homeless liaisons and teachers helps states identify more homeless students so they can be provided with the resources they need to succeed in school. School administrators and teachers are often unaware of the correct definition of homelessness, which includes children and youth who are sharing the housing of family members or others due to loss of their own housing. Regular trainings to school officials allow them to stay informed of changes to federal and state definitions and policies regarding homeless students and helps connect students to the resources they need.
Young children who experience homelessness face developmental delays that may impact the rest of their lives. This is concerning given that children in Kindergarten through the third grade are over-represented in the homeless student population compared to all children. Though high school-aged youth are under-represented in the homeless student population, they still face severe risk factors due to homelessness. Homeless youth display higher rates of behavioral disorders, are much more likely to have used hard drugs, and are at increased risk for depression compared to their housed peers. The effects of homelessness on outcomes for children and youth persist even after controlling for poverty and other factors.
Map 5
Homeless Children as a Percent
of Extremely Poor Children
in Kindergarten–Grade 12
Ranked by State, SY 2014–15
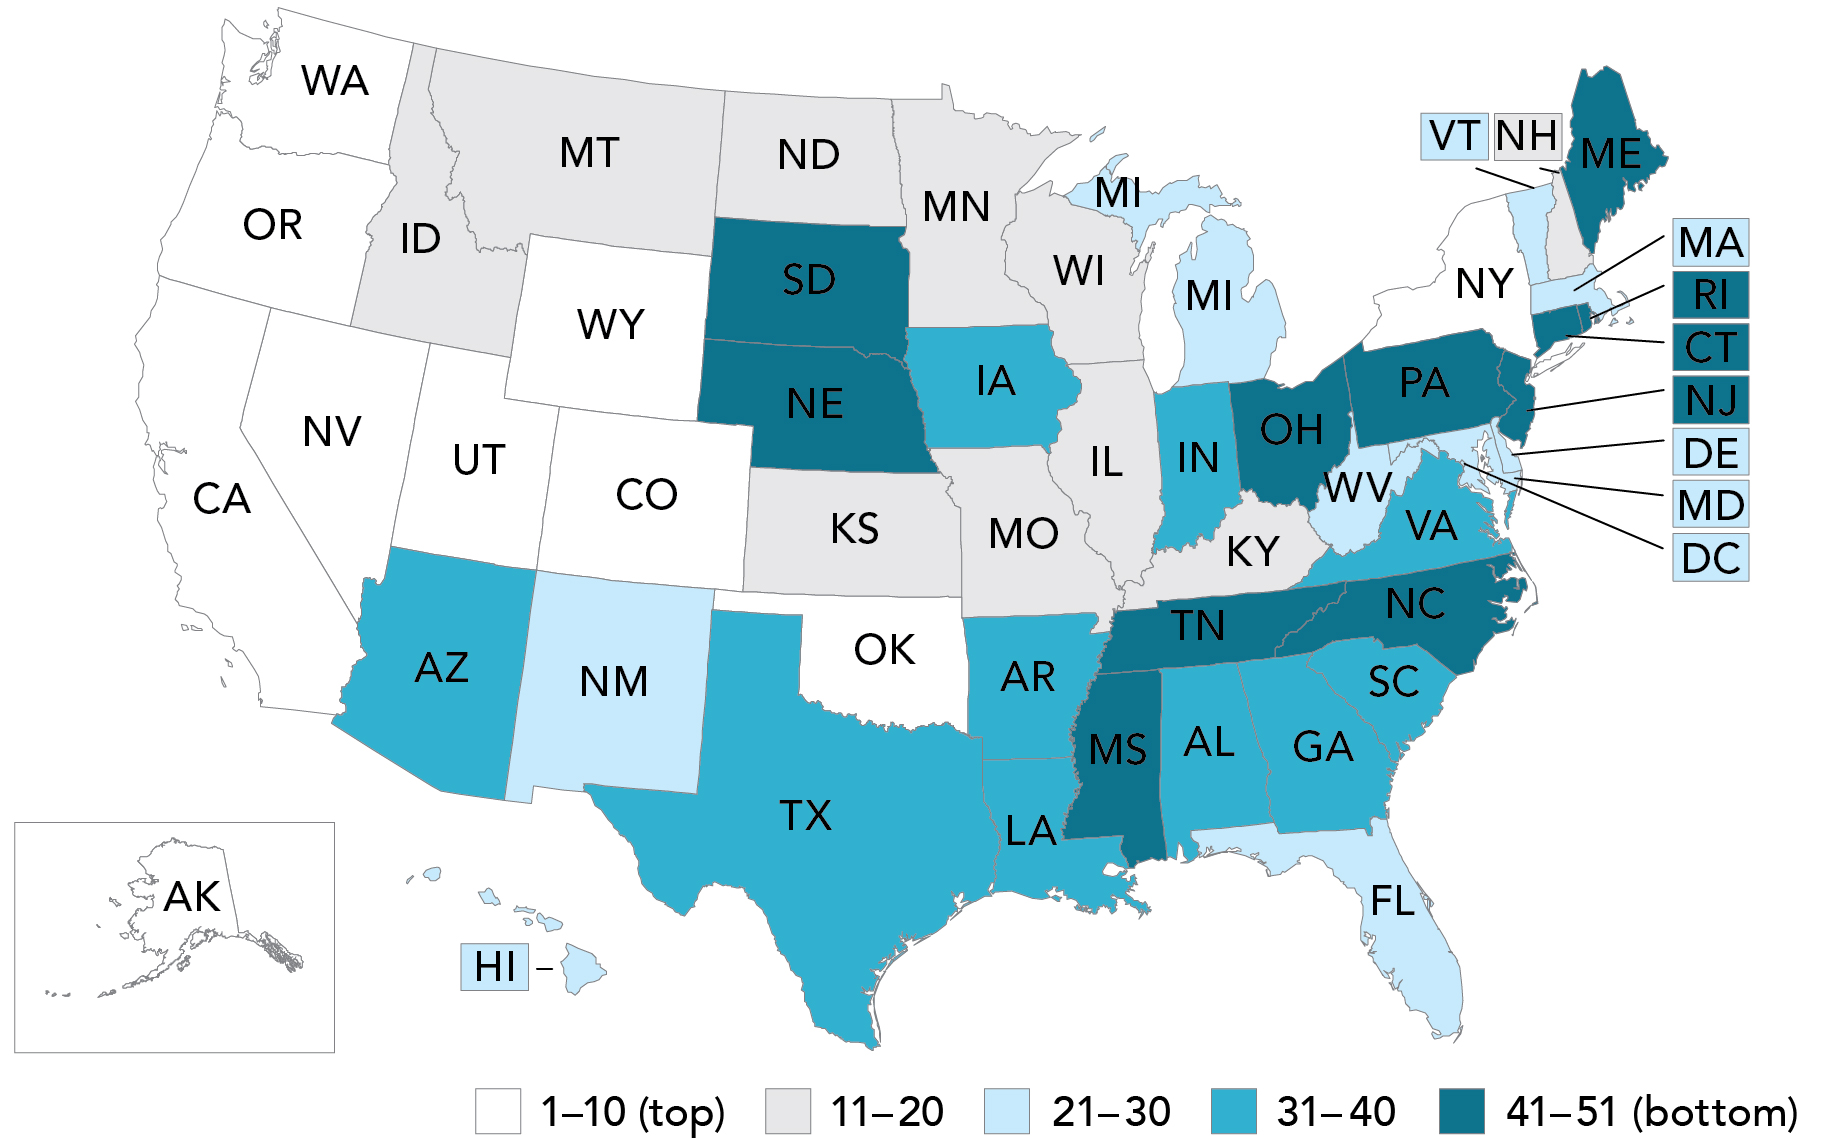
Table 5
Homeless Children as a Percent
of Extremely Poor Children
in Kindergarten–Grade 12
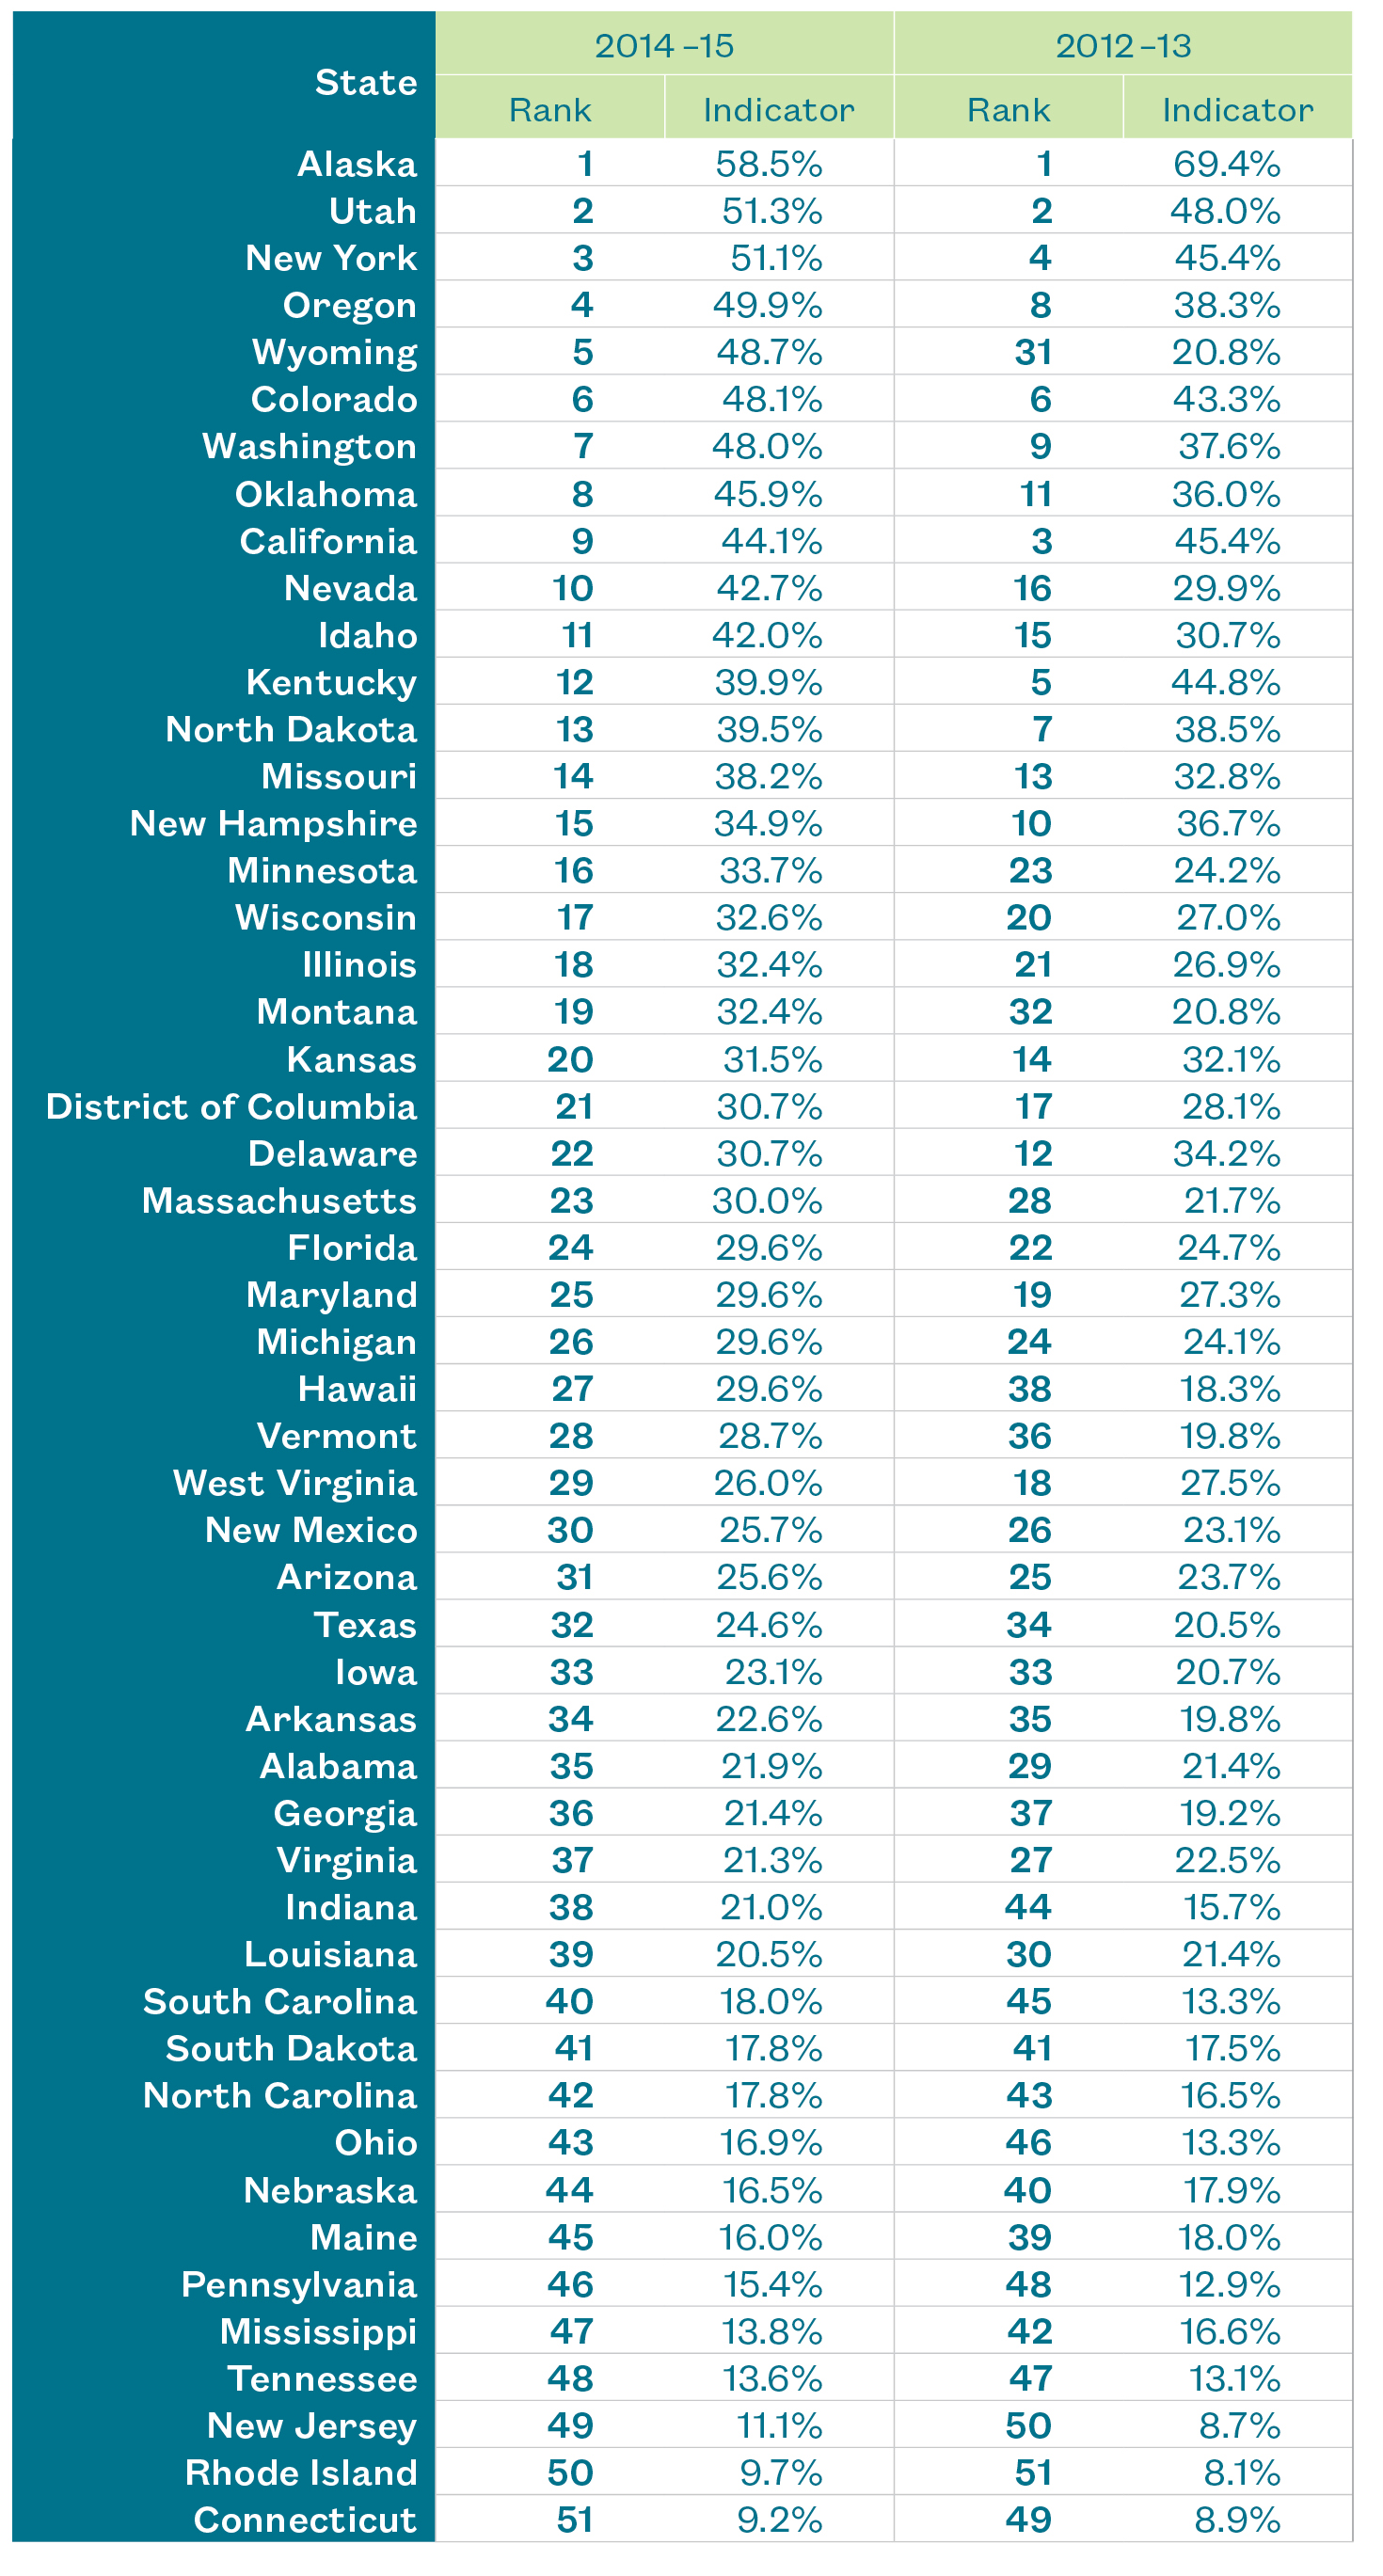
Figure 6
States with the Highest
and Lowest EHCY Funding
Per Homeless Student
The amount of money that states receive through EHCY varies widely, as does the per-student value that these allocations represent. At $220 per homeless student, Rhode Island received nearly 9 times as much as Oklahoma, where a $693,626 federal grant calculates to $26 per student. On average, states received $50.08 per homeless student in SY 2014–15. Hawaii experienced the largest decline in per-student funding, which dropped from $92 in SY 2013–14 to $59 in SY 2014–15. The decline was due to an increase of 800 homeless students and a $36,000 drop in EHCY allocations.
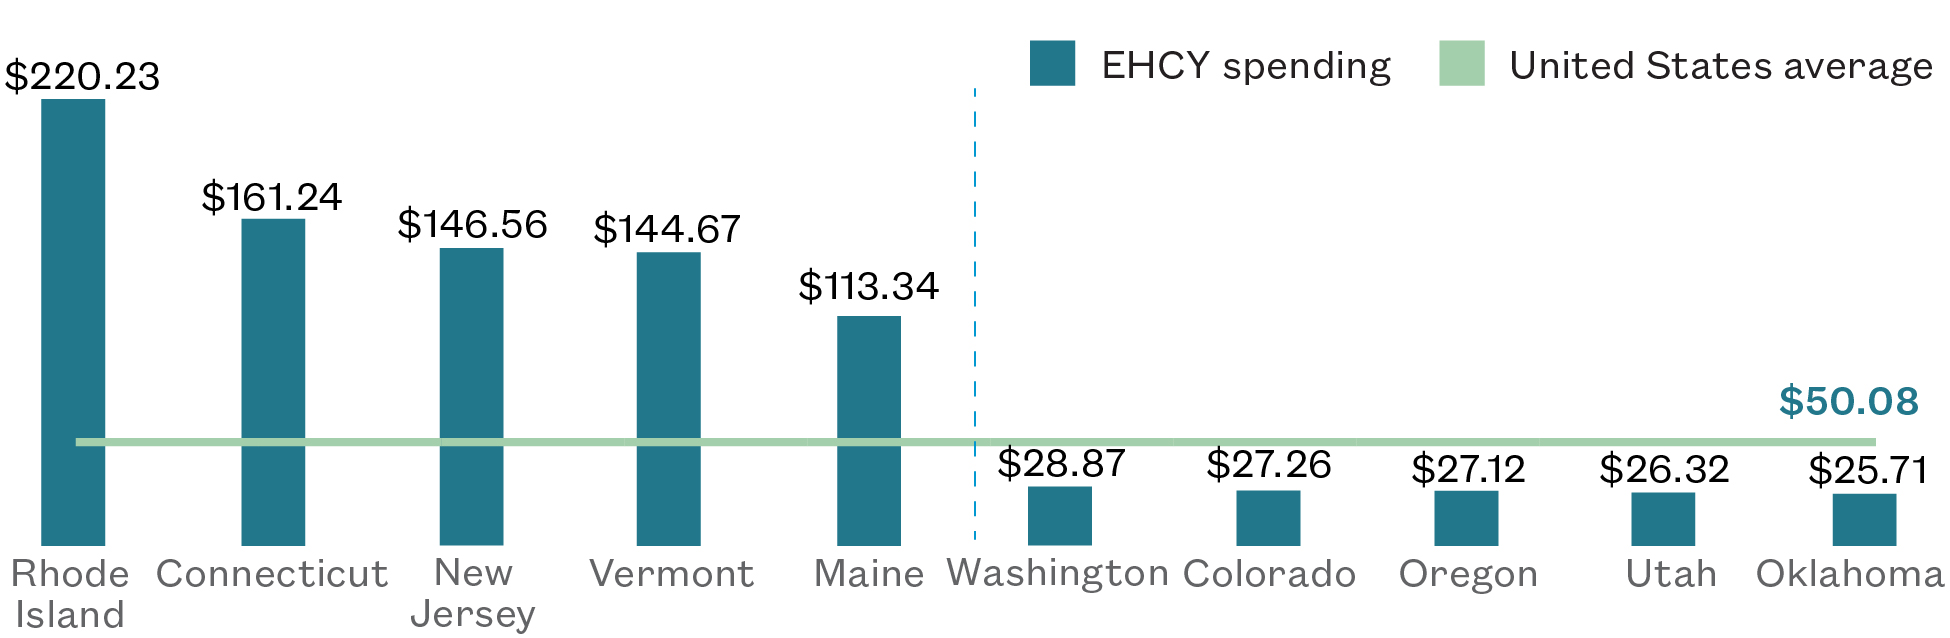
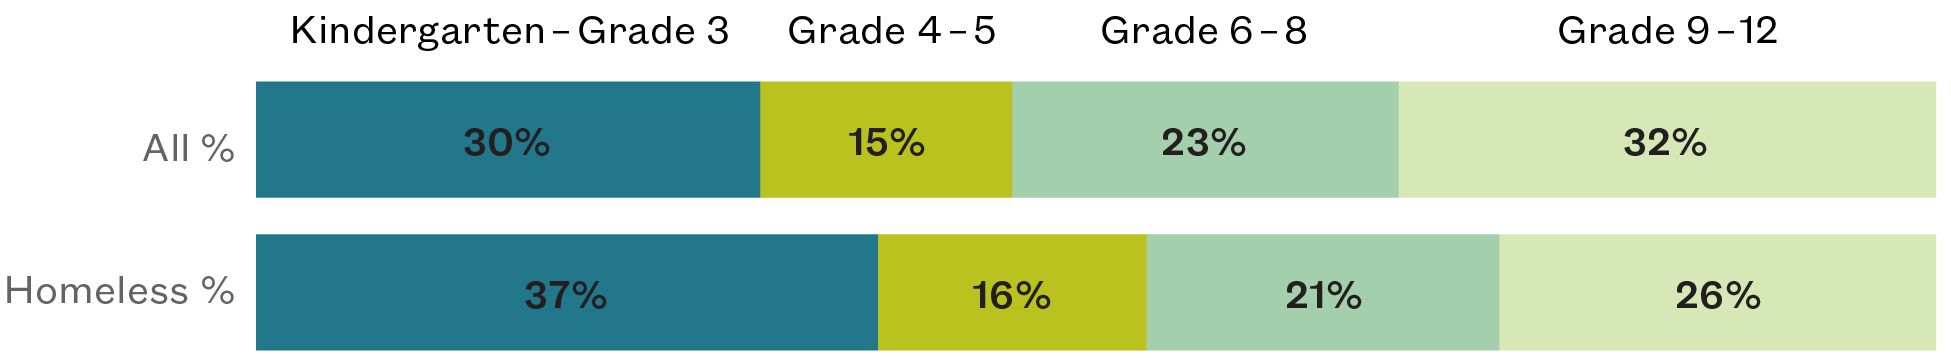
Figure 7
Age Distribution
of All Students
vs. Homeless Students
Student performance in early grades has been shown repeatedly to indicate a child’s success in later grades and beyond school. A significant percentage of homeless students fall into this age range, more than in the overall student population. Thirty-seven percent of all homeless students were enrolled in Kindergarten through 3rd grade, compared to 30% of all students. In eight states, over 40% of all homeless K–12 students were in the 3rd grade or below, and in nine states, the proportion of homeless students in these grades was more than ten percentage points higher than the total student population.
Spotlight on Alaska
Number one for 2014–15 in identifying
homeless students in Kindergarten–Grade 12
![]()
“We want to identify everyone who is eligible, but we also want to see those people get out of our program as quickly as possible. We try to make connections with families so that we see them get back on their feet and into permanent housing again. We provide services to the students. In addition to transportation, backpacks and school supplies, we have tutoring programs and general support for the families and advocacy at the school level, which is really important. We let the schools know we’re here for the kids. We’re going to advocate for what is in the best interests of that student.”
Dave Mayo-Kiely, Program Coordinator
Child in Transition Program, Anchorage School District
Alaska’s success in identifying homeless students in grades Kindergarten–12, which has led it to be ranked first for this indicator, is largely due to the systems established over several years. The state regularly collects and disseminates information on homeless students through the Department of Education and Early Development (DEED). Alaska effectively utilizes the Homeless Management Information System to collect data on homeless individuals in a standardized, systematic way. These data can be used to track the effectiveness of different interventions, which helps service providers and policymakers implement more successful solutions to homelessness.
Alaska also created an Interagency Council on Homelessness in 2004, which includes members from the state Departments of Education, Public Safety, Corrections, Health, the homeless provider community, and other professionals. By encouraging the collaboration of professionals from several sectors that work with homeless populations, Alaska could more comprehensively address homelessness in the state. In addition, Alaska’s ten-year plan to end long-term homelessness by 2019 includes a strong focus on children and families. The plan’s five-year progress report cited an 18% decline in homelessness among families with children and a 50% increase in the participation of homeless school liaisons in the state housing coalition.
One in five homeless individuals in Alaska was a child or youth under the age of 18 in SY 2014–15. American Indian and Alaska Natives were over-represented among youth and families, comprising 50% of unaccompanied youth and 44% of persons in homeless families. While the number of homeless children and youth enrolled in public school remained steady between SY 2012–13 and SY 2014–15, the percentage of sheltered children and youth increased from 23% to 26%. This increase in children living in shelters was accompanied by a decrease in children living in hotels and motels.
Alaska received approximately $167,000 in McKinney-Vento funding in FY 2013 and an estimated $165,000 in FY 2015. The state awarded sub-grants to just four of the 54 LEAs in Alaska in 2015; however, 90% of Alaska’s homeless students attended school in districts with a sub-grant. This may be due to the concentration of the state’s homeless students in the more densely-populated districts that received sub-grants, though it is possible that districts without sub-grants could be under-identifying homeless students.
Spotlight on Wyoming
Most improved in addressing the needs
of Kindergarten–Grade 12 students
“We found that many LEAs were depending on families to self-identify as homeless, rather than going out into the community to affirmatively seek out and identify eligible children. We have found that universal screening through the use of a residency questionnaire for all students has been effective in increasing identification in LEAs where it is in use. For example, one LEA was able to increase the number of students they served through the McKinney-Vento program from two in one year, to 52 the following year, simply by changing two or
three sentences on their registration form.”
Kenya Haynes, State Coordinator
Homeless Education, Wyoming Department of Education
Wyoming’s Department of Education has increasingly placed an emphasis on addressing homelessness among children and youth. Indeed, Wyoming showed an early commitment to the education of homeless students by being one of only five states to begin reporting homeless graduation rates years before ESSA required all states to do so. The state significantly improved its efforts to identify homeless students in recent years by using lessons learned from an ED analysis to improve its monitoring of homeless students. Guidance from the state homeless coordinator helped school districts to improve their procedures and identify a significantly higher number of homeless students in SY 2014–15 compared with SY 2012–13.
The percentage of extremely poor Kindergarten–12th grade students identified as homeless more than doubled over SY 2012–13 to SY 2014–15, from 21% to 49%. This was due to a 52% increase in the number of homeless Kindergarten–12 students, which jumped from 1,038 to 1,577 students over that time, in addition to a 35% drop in the number of extremely poor children. Though the number of homeless students identified by Wyoming increased substantially between SY 2012–13 and SY 2014–15, McKinney-Vento funding to Wyoming increased by only 5%. Over the same period, the number of LEAs receiving McKinney-Vento sub-grants dropped from six to four and the percentage of homeless students enrolled in an LEA that received a sub-grant declined from 52% to 40%.
Despite the stagnation in federal funding, Wyoming improved significantly in its ability to identify homeless students. The state has taken steps to improve school board procedures following a U.S. Department of Education analysis of homeless education data in 2013, which flagged 28 Wyoming school districts for having large numbers of statistical outliers and missing data. The state recognized that prior to SY 2013–14, many school districts were unaware of their responsibilities under the McKinney-Vento Act. Many districts were not actively identifying homeless students, but were leaving families to identify themselves. In addition, some school board policies were found to misquote federal law, while some included automatic referrals of homeless students to the Department of Family Services.
In response to these findings, school districts were instructed of their responsibilities under McKinney-Vento and were encouraged to begin using enrollment questionnaires to identify homeless students at the point of entry. Expanded monitoring indicators were also put into use beginning in SY 2013–14. Prior to the start of SY 2014–15, Wyoming’s state homeless coordinator hosted a technical assistance retreat for district homeless liaisons and school personnel to instruct them on their responsibilities and the rights of homeless students under the McKinney-Vento Act.
In addition to Wyoming’s increased efforts to identify homeless students, another factor in the state’s improved ranking is the increase in total family homelessness in the state. The boom in Wyoming’s energy industry attracted many families from other states who moved in search of work, which contributed to an increase in housing costs and left many families unable to afford housing. Family homelessness is particularly a problem for Native American tribal communities, in which a housing shortage has caused severe overcrowding in multigenerational households.
Nonetheless, Wyoming is working to improve its ability to serve homeless students. Following the sharp increase in the number of homeless students between SY 2012–13 and SY 2013–14, Wyoming began to recognize Children and Youth Homelessness Awareness Month in 2015. In the same year, the state developed a 10-year plan to end homelessness in collaboration with the Department of Family Services. More recently, Wyoming passed a bill to allow unaccompanied homeless youth to obtain their own birth certificates and enter into binding agreements without a parent or guardian.
Return to top.
Doubled-Up Homeless Students
in All Grades
as an indicator of support and identification
These students are often referred to as the “hidden homeless.” Due to the nature of their doubled-up status, these students are disconnected from shelter-based support services such as counseling and medical care. Additionally, students living doubled up often end up moving between the homes of different family members and friends.
For doubled-up students, or individuals who are staying in a temporary shared housing arrangement due to economic hardship, the effects of homelessness can be especially harsh. Often referred to as the “hidden homeless,” these students are only included in ED’s definition of homelessness, and not included in any counts of homelessness by HUD. Due to the nature of their doubled-up status, these students are disconnected from shelter-based support services such as counseling and medical care. Additionally, students living doubled up often end up moving between the homes of different family members and friends. This creates an unstable living environment for children, whose development can be negatively affected by residential instability. In fact, it has been shown that students facing housing instability are more likely to experience stress, grade retention, behavioral problems, and are more likely to drop out of high school. These students are also more likely to transfer schools as a result of the need to move between temporary living arrangements, with each transfer causing them to fall further behind in their learning.
The identification of doubled-up students can be challenging for several reasons. Doubled-up families may not be aware that their children qualify for legal protections under the McKinney-Vento law, or they may be hesitant to volunteer their homeless status due to social stigma. School liaisons who are responsible for outreach to homeless students are also frequently burdened with other job duties and may not be able to dedicate adequate time to engaging with students who may be homeless. ESSA addresses some of these issues by requiring clear outreach and identification plans to be included in school and LEA-level planning. ESSA also mandates increased professional development and training for liaisons and other school administrators responsible for providing services to homeless students.
Between SY 2011–12 and SY 2014–15, the number of students nationwide who were identified as doubled up increased by nearly 90,000. This increase has coincided with a nationwide decrease in the number of transitional housing units available to homeless families. Previously, the ratio of doubled-up homeless students to those in shelter was used to produce the rankings for this indicator, working from the assumption that a higher ratio would suggest that states were effectively finding these hidden homeless students. The widespread reduction in the number of shelter units available to homeless families, however, resulted in this measurement being distorted, as states with fewer transitional housing units received artificially high rankings regardless of the quality of their identification practices.
Under the new indicator, which measures the number of doubled-up students as a percentage of all students, Kentucky is ranked first, with doubled-up students making up 3.3% of its total student population. California and Oklahoma also had doubled-up proportions above 3%. Of the ten states with the highest identification rates of doubled-up students, seven were also in the top ten for the 2012–13 school year. The 11th-ranked state, Alabama, rose the most in the rankings, moving up 13 spots and raising its identification rate from 1.7% in SY 2012–13 to 2.2% in the 2014–15 school year.
Map 6
Ratio of Homeless Students
Living Doubled Up
to Total Students Enrolled
Ranked by State, SY 2014–15
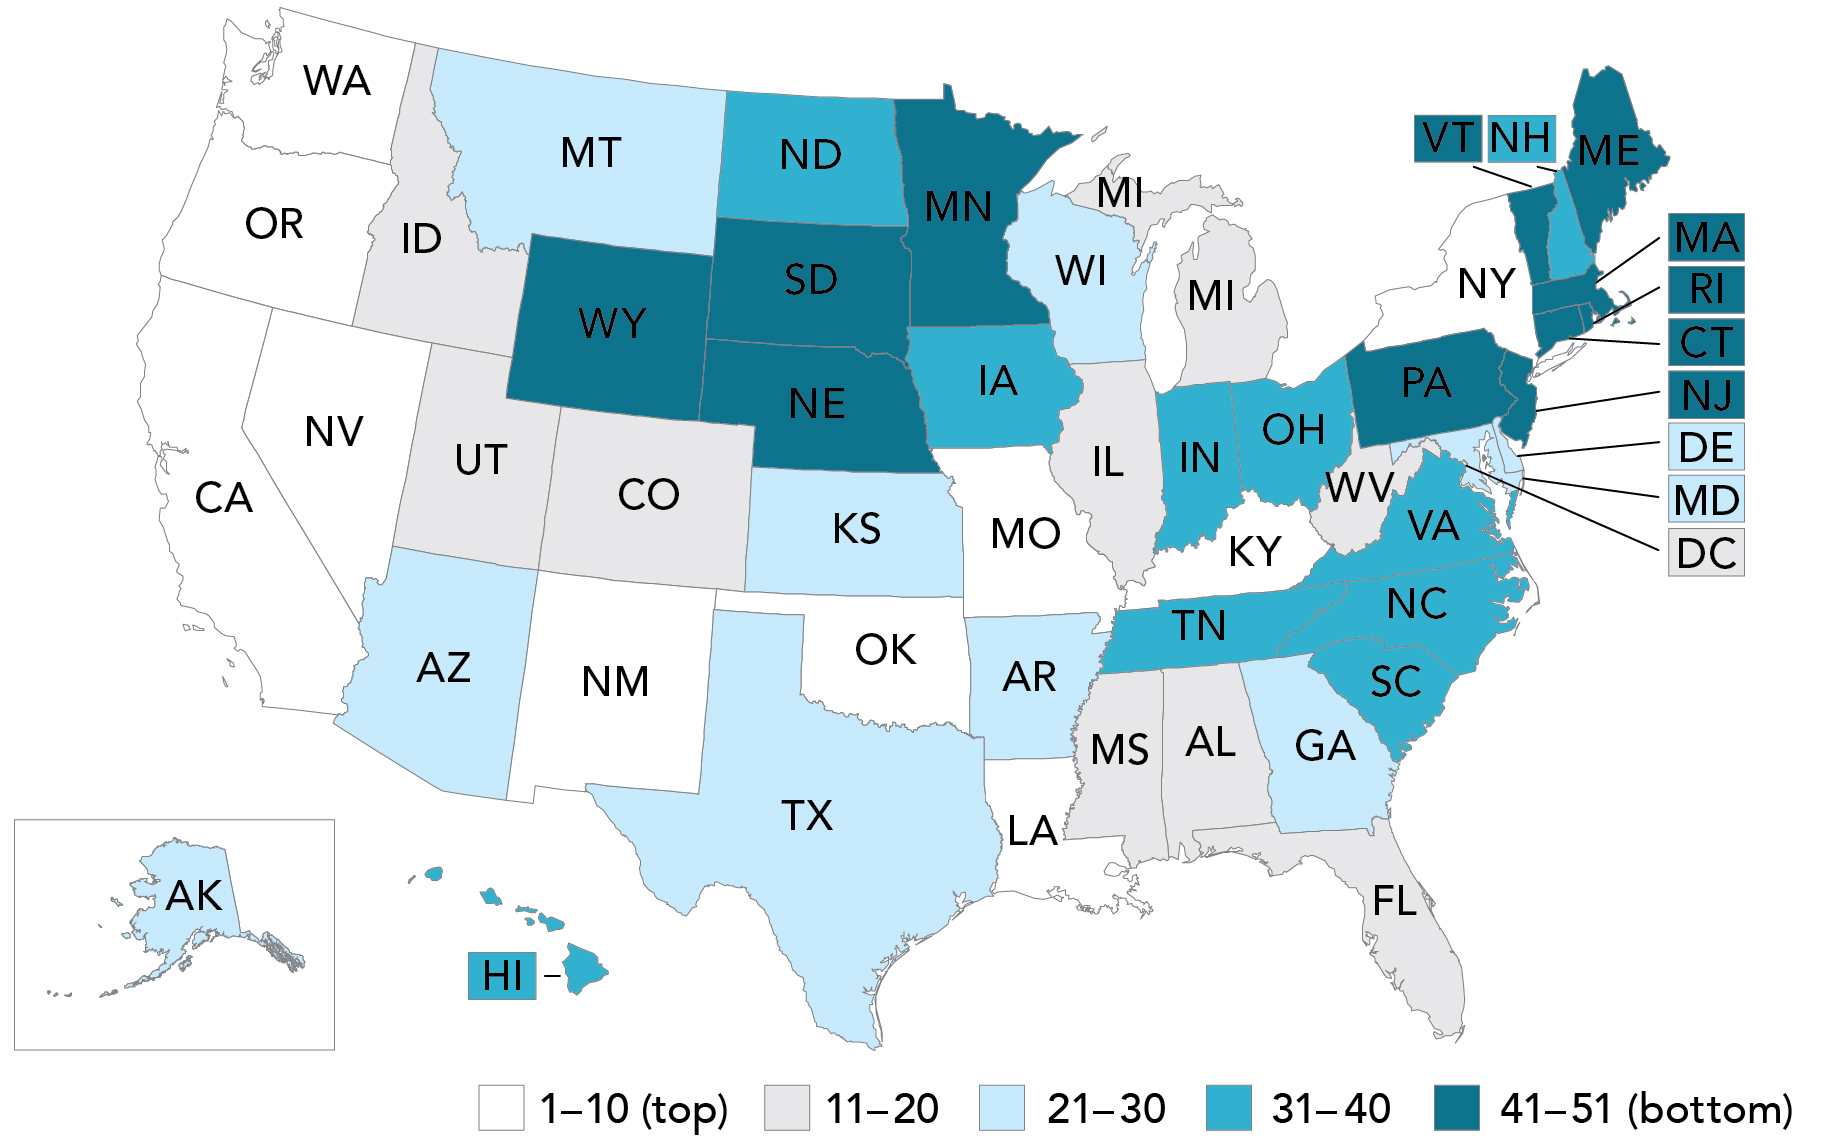
Table 6
Ratio of Homeless Students
Living Doubled Up
to Total Students Enrolled
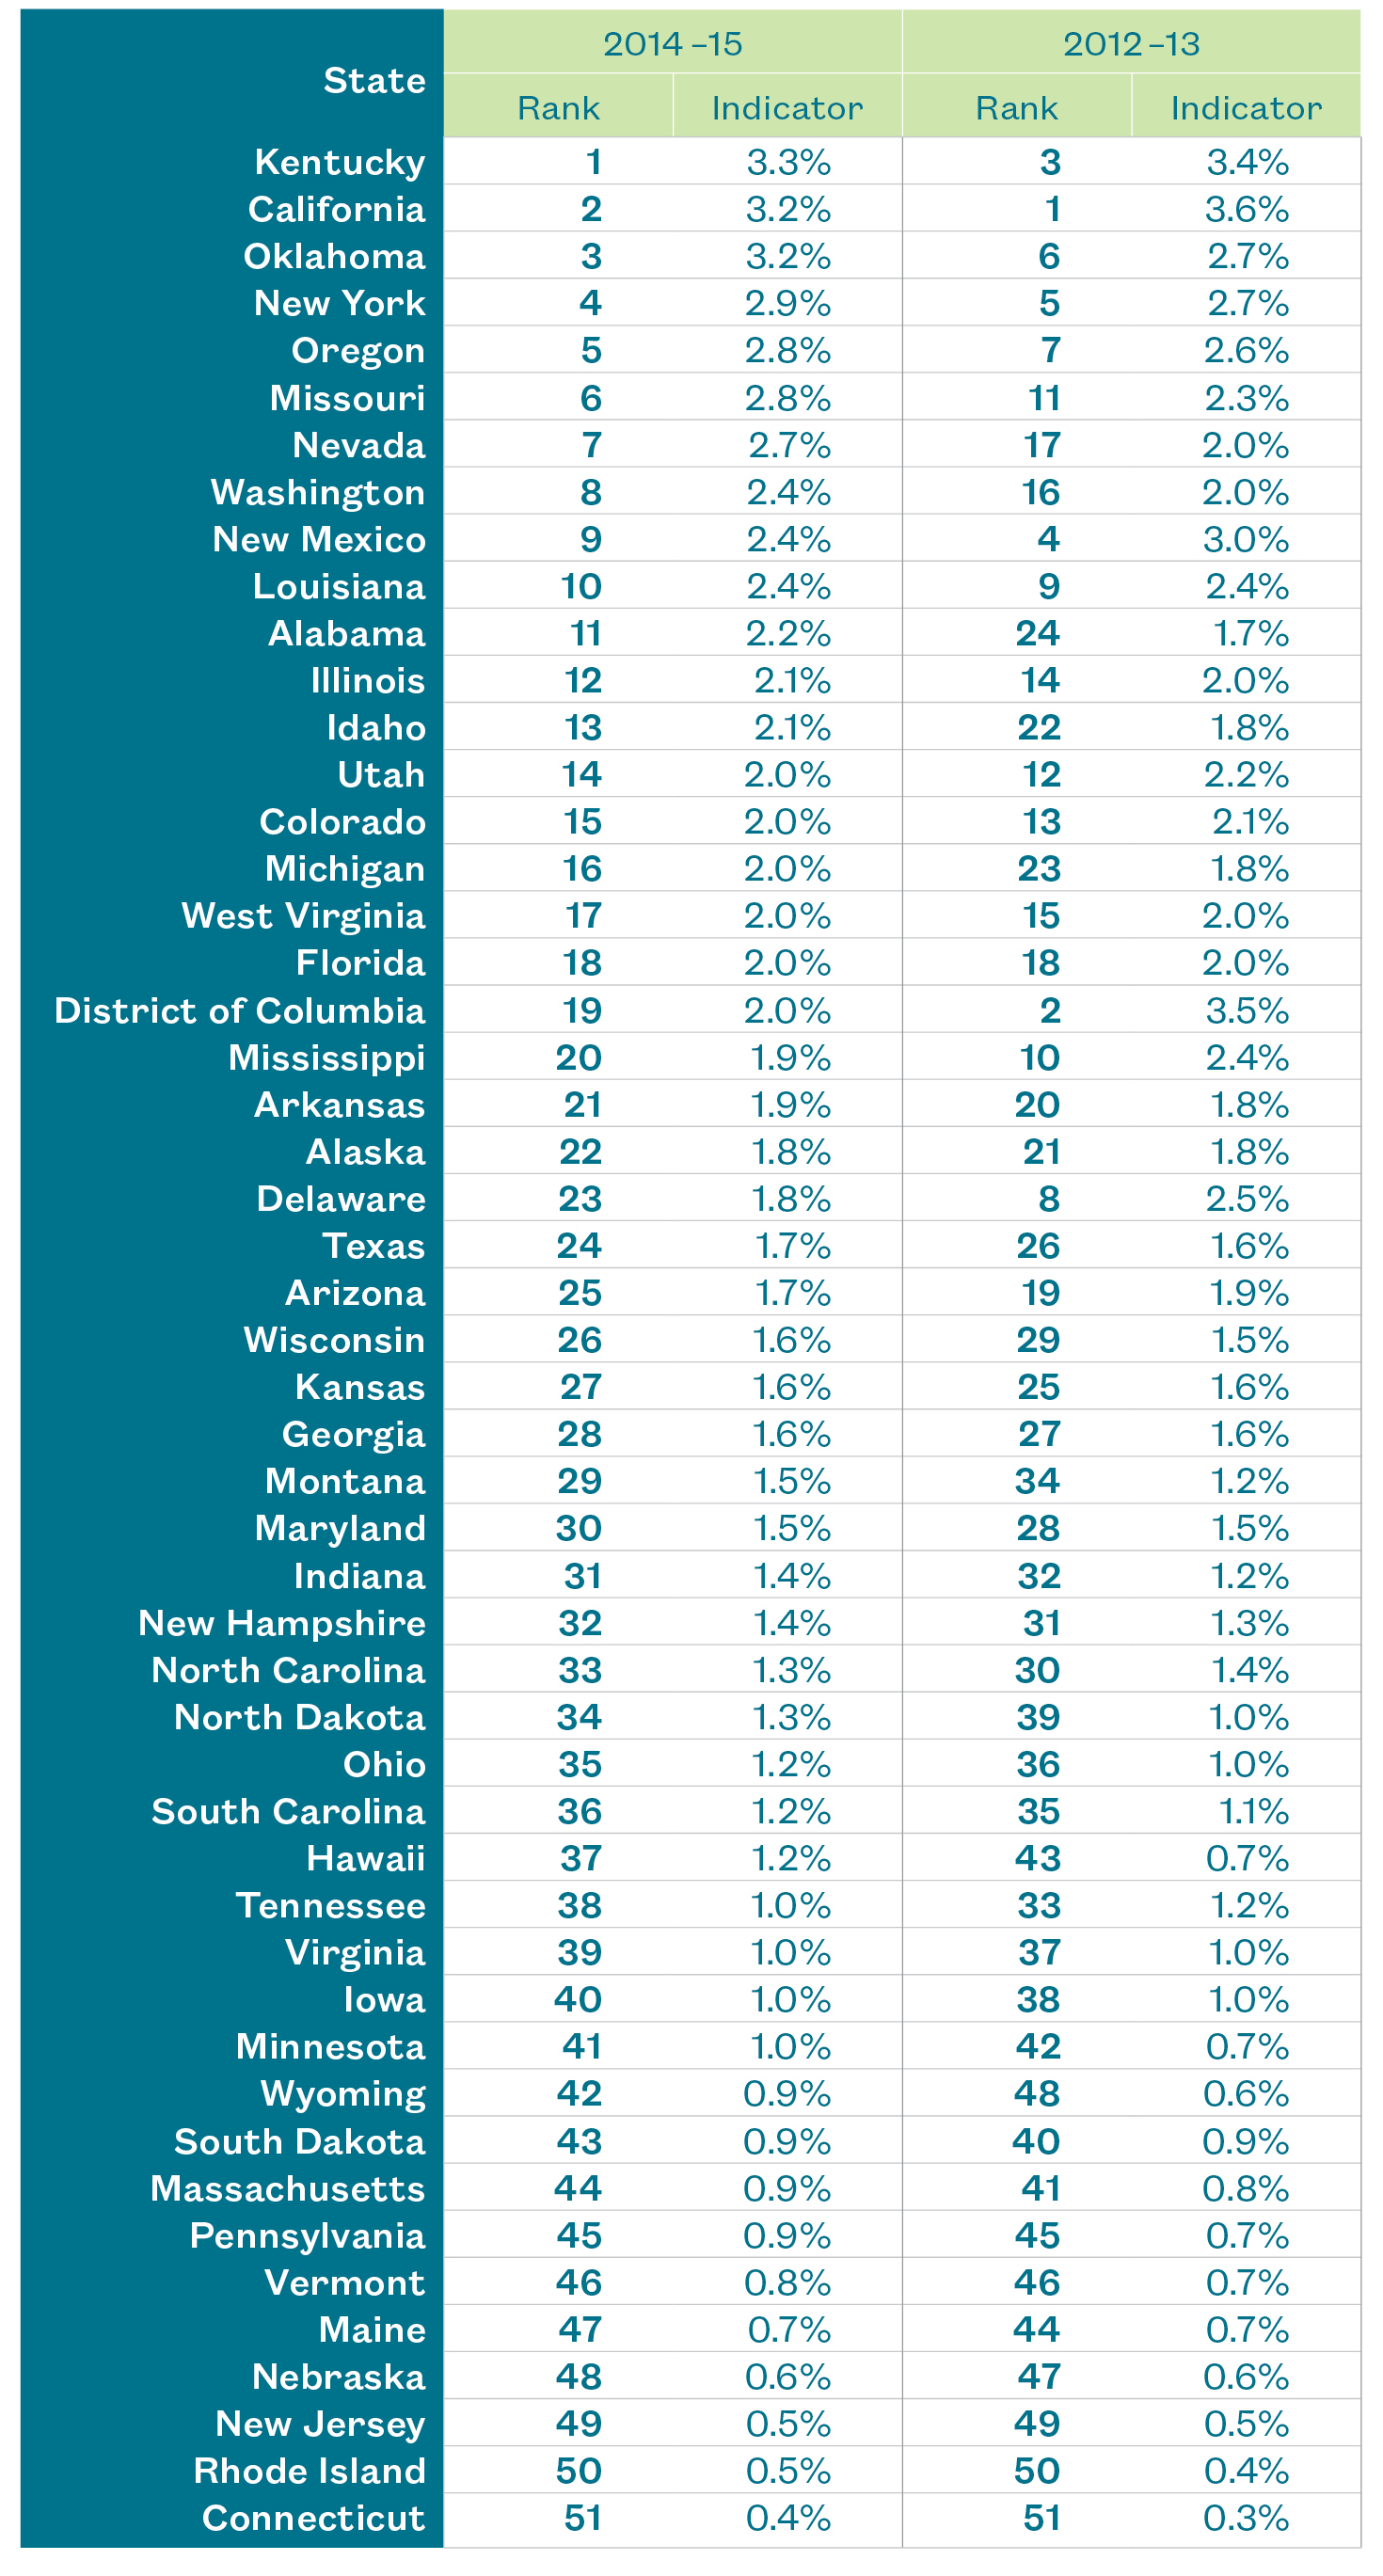
Figure 8
Inflation-Adjusted Annual Spending Totals
FY 2012 to FY 2015
From FY 2012 to FY 2015, HUD spending on renewal transitional housing projects dropped substantially from approximately $431 million to $172 million—a 60% decrease. Spending on new transitional housing projects was eliminated after FY 2012. At the same time, spending on new rapid re-housing projects and renewal rapid re-housing projects jumped by $85 million and $99 million, respectively. The change in HUD’s spending priorities away from transitional housing and toward rapid re-housing was largely based on findings from its Family Options Study, a three-year experimental study that evaluated the effectiveness of three types of housing interventions on more than 2,200 families.
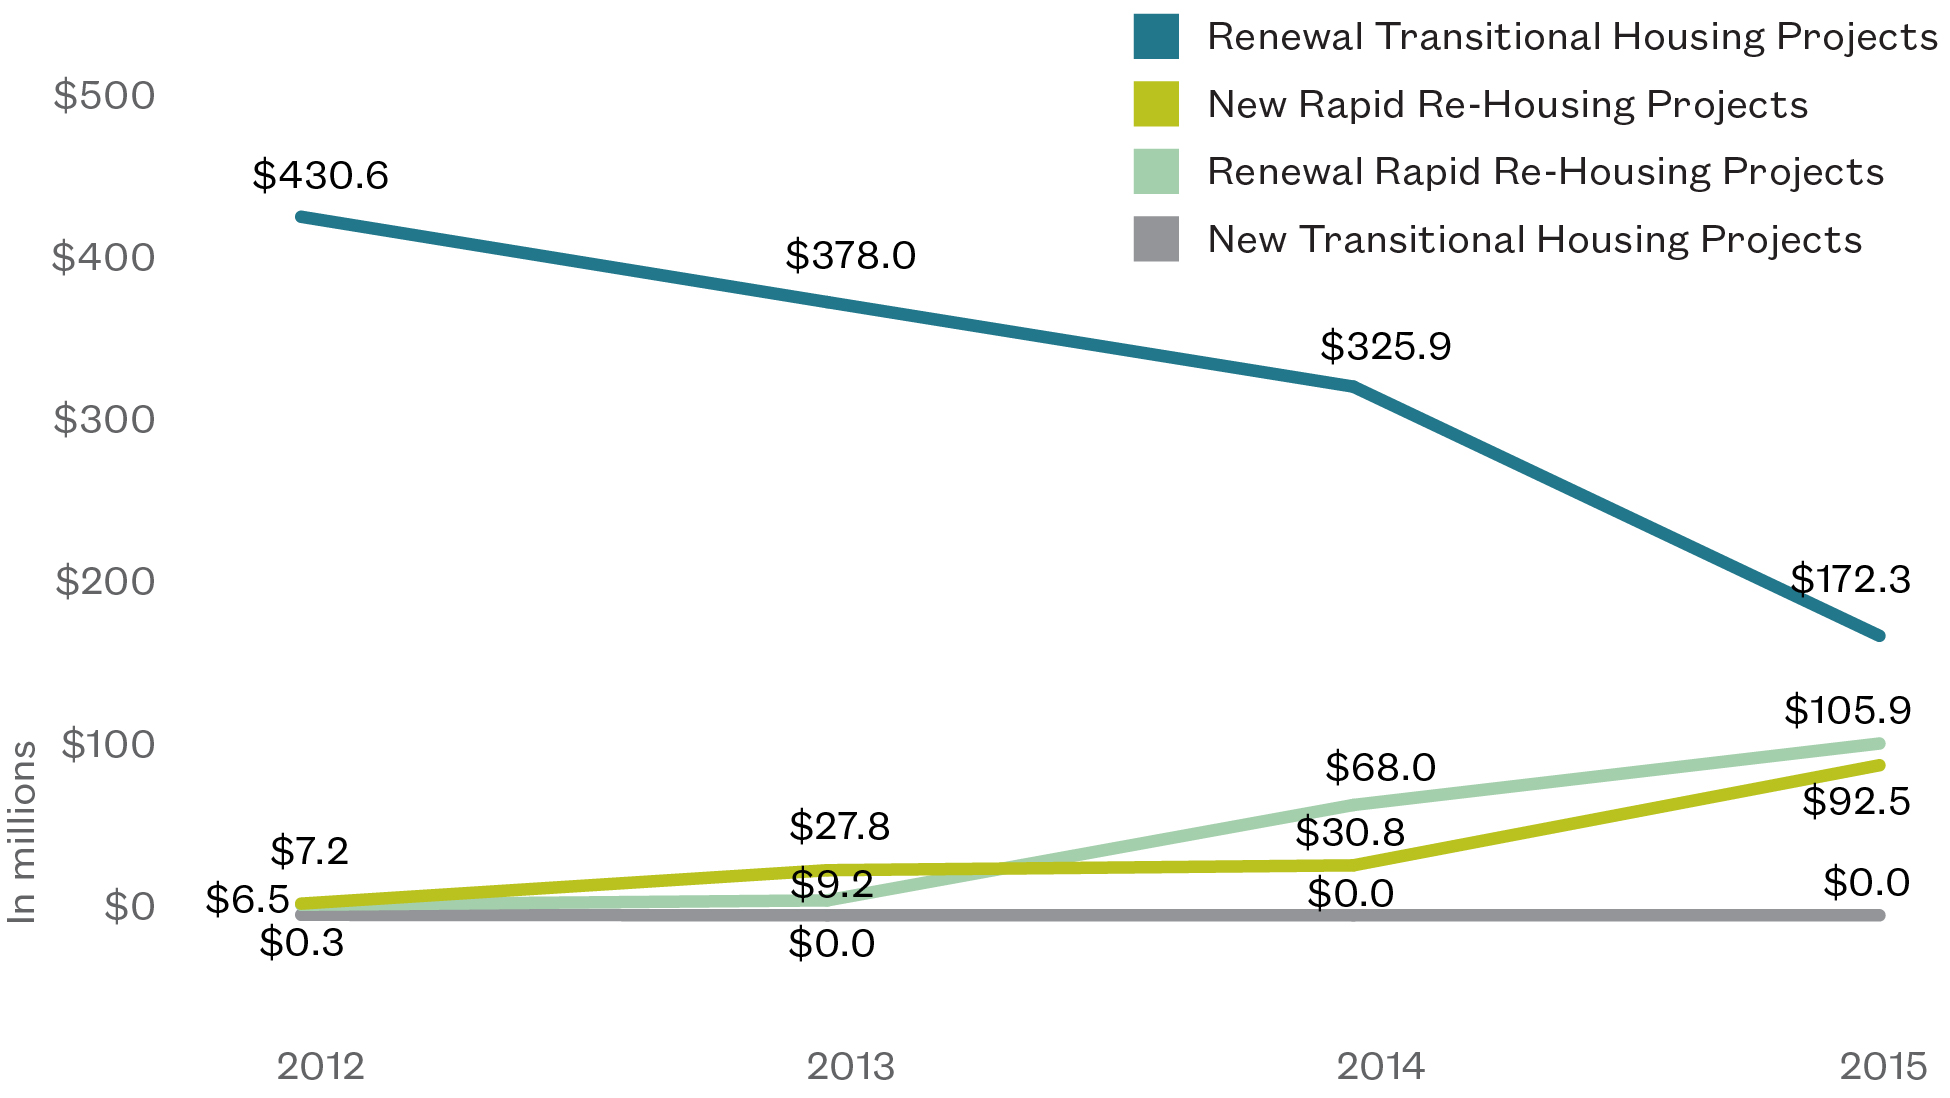

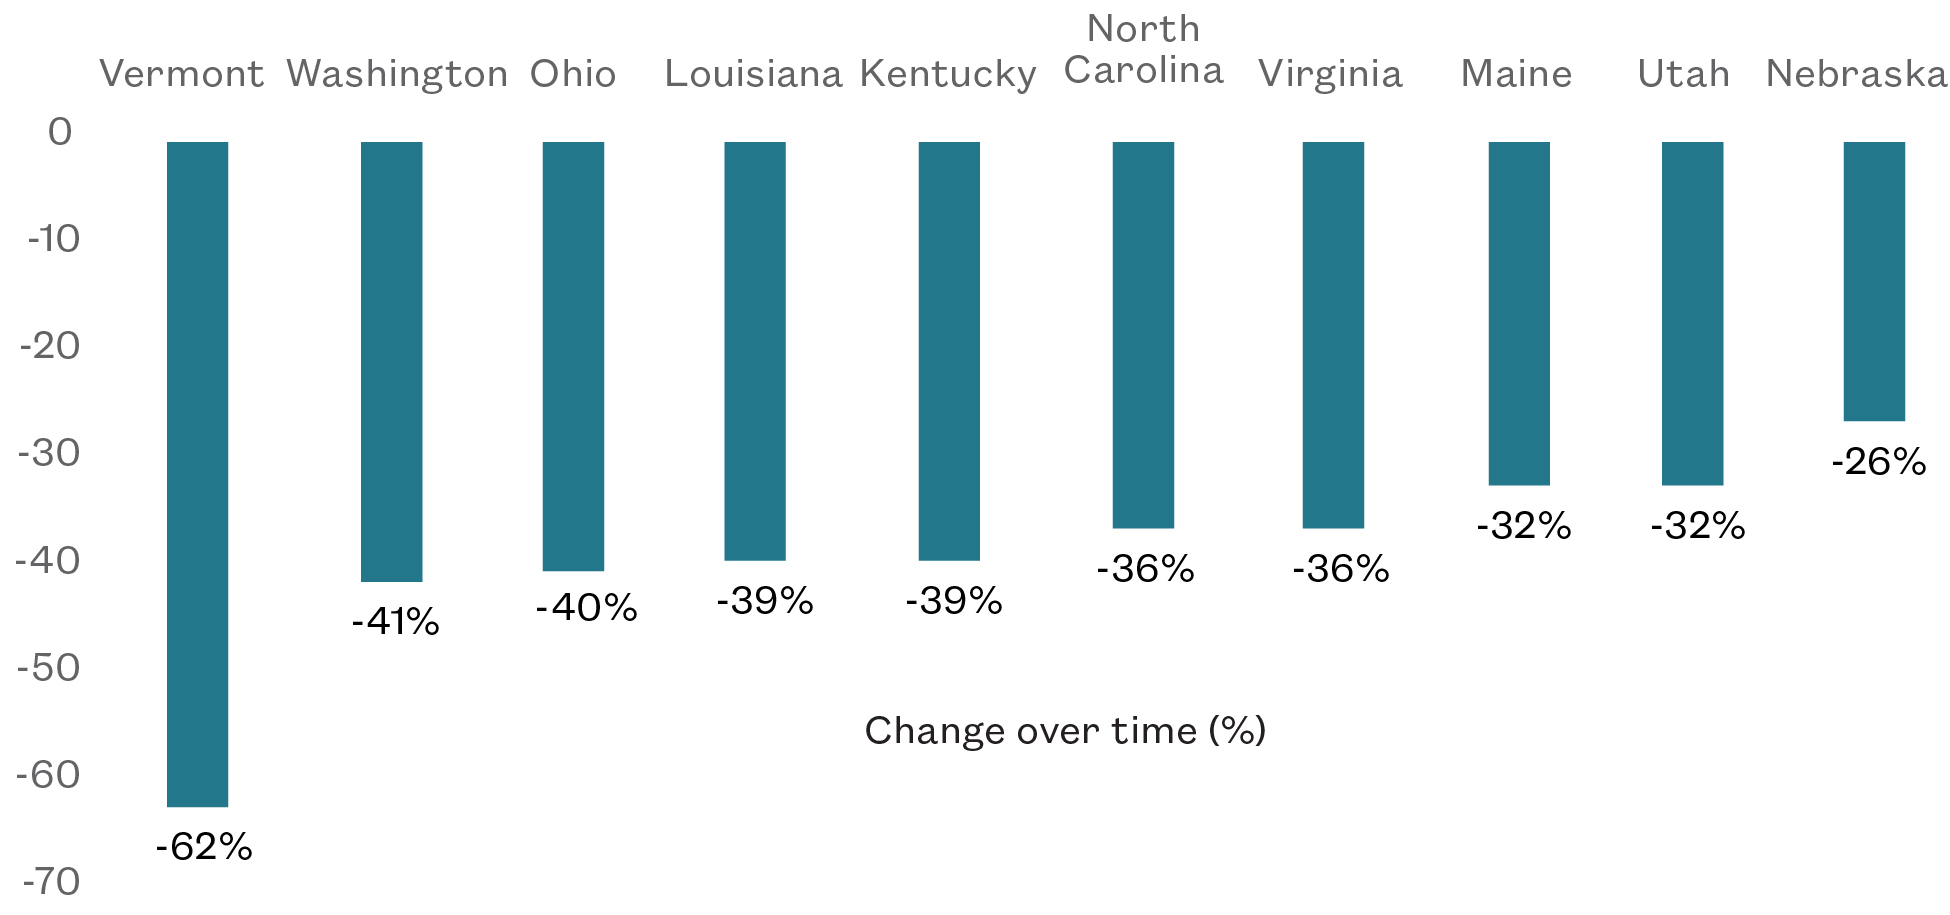
Figure 9
Largest Decreases
in Family Shelter Capacity, 2013–15
From 2013 to 2015, thirty-nine states saw reduced shelter capacity, with twelve of these states experiencing a reduction of 25% or more. Vermont’s capacity dropped sharply from 316 shelter units in 2013 to only 121 in 2015. Washington lost 1,663 shelter units, going from 4,078 in 2013 to 2,415 in 2015. In Washington, the decline in shelter capacity led to increases in the percentage of students who lived doubled up, unsheltered, and in hotels or motels. Across the country, nearly 7,000 shelter units, or 10% of total units, were lost between 2013 and 2015.
Spotlight on Kentucky
Number one in identifying doubled-up students in 2014–15
![]()
“Districts have said the biggest challenge in identifying homeless students is having a consistent way to ask the right questions. A lot of the districts struggle with what kind of questions to ask without being offensive. …
Because we have the information system, we are able to do a lot of training on how to do record file transfers for students who transfer across the state of Kentucky and to make sure those indicators and living status go with the student, whether they go to a different district, or to a different facility, then back again.”
Cathy Lazarin, Data Analyst,
Kentucky Department of Education
In SY 2014–15, Kentucky ranked first in the identification of doubled-up students, a sign of the state’s success in finding homeless students staying with other households. While this is positive news because it allows homeless children to be connected to the services they need, the factors leading to the high rate of child homelessness in the state are sobering. High rates of poverty, unemployment, and drug addiction, combined with the state’s declining shelter capacity, have left many of Kentucky’s children vulnerable to unstable living situations.
The state of Kentucky has the highest percentage of doubled-up students, with 3.3% of its student population identified as living doubled up in SY 2014–15. In total, nearly 22,600 students were living doubled up in SY 2014–15, a small drop from approximately 23,100 in SY 2012–13. At the same time, the number of total students increased by approximately 3,500.
One factor contributing to Kentucky’s high identification rate of doubled-up students is the state’s increased focus on child and youth homelessness. Kentucky established its Interagency Council on Homelessness in 2007, which became a statewide council in 2009. The Council’s executive committee membership includes representatives from the Education Cabinet and the Health and Family Services Cabinet. The Council’s goals demonstrate a strong focus on student homelessness, including training all school personnel on the legal requirement of enrolling homeless children; promoting full implementation of the McKinney-Vento Act; distributing annual reminders of McKinney-Vento provisions to school personnel; and developing an immunization database to facilitate enrollment of homeless children who lack copies of their immunization records.
School officials in Kentucky have become more aware of child and youth homelessness, especially in Jefferson County, where there is a high concentration of homeless students. Student homelessness in Jefferson County increased gradually over the previous decade to a peak of approximately 12,000 students in 2012–13, or 12% of the student population. To address the problem of rising student homelessness, Jefferson County Public Schools (JCPS) participated in a cross-training with two other agencies in 2010, which resulted in the creation of an interagency homeless youth working group that includes members from JCPS.
Also within Jefferson County, the Coalition for the Homeless in Louisville has been working to reduce youth homelessness since 2013. The Coalition’s plan to reduce homelessness includes the goal of creating a homeless children’s task force to develop recommendations on reducing the number of homeless children in school. In addition, it created the Coalition Supporting Young Adults, which mapped existing community resources for homeless youth and identified service gaps and opportunities.
Unfortunately, Kentucky’s school officials also note an increase in child and youth homelessness due to parents overdosing on heroin or becoming incarcerated and leaving children in the care of other family members. Until 2013, Kentucky paid relatives a monthly stipend to care for children who would otherwise have been placed in foster care through a program known as Kinship Care. Many in the state have struggled with the financial strain of caring for additional children, though a recent court ruling mandated state payments to those whose custody is only temporary while a child waits for a permanent foster care placement. The exact impact that the suspension of Kinship Care has had on the number of doubled up students is unknown, though it was estimated in 2013 that as many as 60,000 children were living with relatives that had either temporary or permanent custody.
As in many states, Kentucky’s family shelter capacity has also declined sharply in recent years, often leaving homeless families with nowhere to stay but in unstable doubled-up situations. From 2011 to 2015, the number of family shelter units in Kentucky decreased by 50%, from 898 units to just 449. Moreover, the shelters that remain often have very long waiting lists. Not surprisingly, the number of students in shelter decreased by approximately 3,500 students from SY 2012–13 to SY 2014–15.
Spotlight on Alabama
Most improved for identifying doubled-up students,
SY 2012–13 to SY 2014–15
“Families can be embarrassed that they lost housing, whether due to domestic violence, loss of income … . They don’t see themselves as homeless because they envision living in a car or on the street as being homeless. A big part of what we do is educating our families and also the community.”
Denise Riemer,
Homeless Education Liaison/
District Social Worker,
Mobile County Public Schools
Alabama’s ranking for identifying doubled-up students improved more than any other state from SY 2012–13 to SY 2014–15. Over that time, the state has worked to remove barriers to enrollment and improve its identification practices. School districts are leading the way by developing homeless education plans and giving more options to homeless high school students. At the same time, however, it must be recognized that the increased number of doubled-up students in Alabama may be partially attributed to the state’s declining shelter capacity for homeless families.
Alabama improved significantly in its ability to identify doubled-up students, climbing 13 spots, from 24th in SY 2012–13 to 11th in SY 2014–15. In SY 2012–13, Alabama identified 13,000 students as doubled up, which was 1.7% of the student population. In SY 2014–15, approximately 16,600 students were doubled up, or 2.2% of students in Alabama.
One possible reason for the increase in the percentage of doubled-up students in Alabama is the removal of certain enrollment barriers, mainly proof of residency. The McKinney-Vento Act requires schools to immediately enroll children while documents are obtained. However, the Southern Poverty Law Center (SPLC) found evidence of unfair barriers to enrollment in many Alabama school districts where schools asked for documents, including birth certificates and social security numbers, without notifying the parents that these items were not required. The SPLC estimated that these policies affected hundreds of families across the state, which likely included homeless families who often lack documents.
In response to the SPLC’s findings, Alabama’s State Superintendent of Education directed all city and county school systems in the state to use a common enrollment form beginning in SY 2014–15 and provided detailed instructions on which documents can be required at enrollment. The removal of this barrier to enrollment likely contributed to the rise in the number of doubled-up students identified in SY 2014–15.
In addition to documents, another barrier to enrollment is the rigidity of school hours. This is sometimes a problem for high school students who must work or care for a child. Some schools enable homeless high school students to remain in school by offering flexible options, such as a virtual or evening schools. These alternatives to the traditional classroom are offered by Mobile and Montgomery County Schools, and may lead to a lower dropout rate and higher total enrollment among homeless students.
Besides reducing barriers to enrollment, many school districts have developed and implemented homeless education plans to identify, serve, and notify homeless students of their rights. Montgomery County Public Schools, for example, adopted a board policy in June 2014 to ensure that homeless students are identified in a timely manner and receive the services and support to which they are entitled. Mobile County requires all employees of the school system to complete training in identifying homeless students. In addition, school workers distribute flyers to hotels and motels known to be frequented by homeless families and school officials receive referrals from agencies that serve the homeless.
Finally, it should be noted that Alabama’s increase in the percentage of doubled-up students could also be due to the state’s limited shelter capacity for families. As the number of doubled-up students increased by 28% from SY 2012–13 to SY 2014–15, the number of students living in a shelter dropped by 16% over the same time. This drop may be explained by the 21% decrease in shelter capacity, from 526 family units in 2013 to 413 units in 2015. This decline has led to waiting lists at many shelters, which force families to live doubled up with others until they can enter a shelter.
Homeless Students in Special Education
as an indicator of support and identification
“Without proper interventions, homeless students are at risk for a number of adverse outcomes. These students often lack stability in their lives, moving from place to place as their families exhaust housing options.”
The stress of homelessness places children at heightened risk for cognitive, speech, motor, and personal-social developmental delays. Homeless children experience developmental delays that negatively impact their academic success at four times the rate of their housed peers and experience twice the incidence of learning disabilities, such as speech delays and dyslexia. In one study, 25% of homeless children under the age of six were found to have poor social-emotional development. These effects of homelessness are very likely to negatively impact a child’s ability to learn and their future academic achievement, even after they have become permanently housed.
The Individuals with Disabilities Education Act (IDEA) seeks to provide children with disabilities the same opportunities and access to education as students who do not have a disability. IDEA guarantees to all children with disabilities, from birth up to age 21, a free and appropriate public education that meets their needs and prepares them for a successful future.
This indicator measures how many homeless students with special education needs are identified as a percent of all homeless students enrolled in the 2014–15 school year. Homeless students have more difficulty accessing special education services because of factors that complicate the evaluation process and delay service delivery such as chronic absenteeism, high levels of mobility, missing documentation, and the need for parental consent. Each time a homeless child with a disability switches schools, their records and assessments must be transferred, which often disrupts the continuity of special education services. On average, over forty percent of homeless children attend two different schools in a given year, and more than 1 in 4 attend at least three schools in one year.
Problems of under-identification, service delivery, and quality are amplified because of budget constraints and have disproportionate consequences for high-poverty districts. Local governments are forced to cover the majority of expenses associated with providing a free and appropriate public education to children with disabilities through their tax base. In FY 2015 the average expenditure per student requiring special education services was $11,534, though the federal government only appropriated $1,843 for every IDEA-eligible student. Limited funding can result in reduced hours for para-educators and the hiring of fewer special education staff, such as speech pathologists and social workers.
States with the largest proportions of homeless students with disabilities were generally found in the Northeast. Maine had the highest rate at one-third (31.0%) of homeless students being identified with a disability, while Vermont and Rhode Island followed with 29.7% and 28.2% respectively. The states with the smallest proportion of homeless students with disabilities were generally in the South. Louisiana had the lowest rate at 7.4%, followed by Alabama at 8.6% and Texas at 11.9%.
Thirty-four states and the District of Columbia increased their identification rates of homeless students with disabilities between SY 2012–13 and SY 2014–15. During this time period the national average of homeless students with disabilities increased by 1.6 percentage points. Among the 15 states whose identification rates declined, the average decrease in homeless students with disabilities was 2.3 percentage points.
Vermont increased its identification rate of homeless students with disabilities by 7.5 percentage points, more than any other state, between SY 2012–13 and SY 2014–15. By contrast, Kentucky’s identification rate of homeless students with disabilities decreased 12.5 percentage points, from 33.4% in SY 2012–13 to 20.9% in SY 2014–15.
Map 7
Percentage of Homeless Students
Identified as Having a Disability
Ranked by State, SY 2014–15
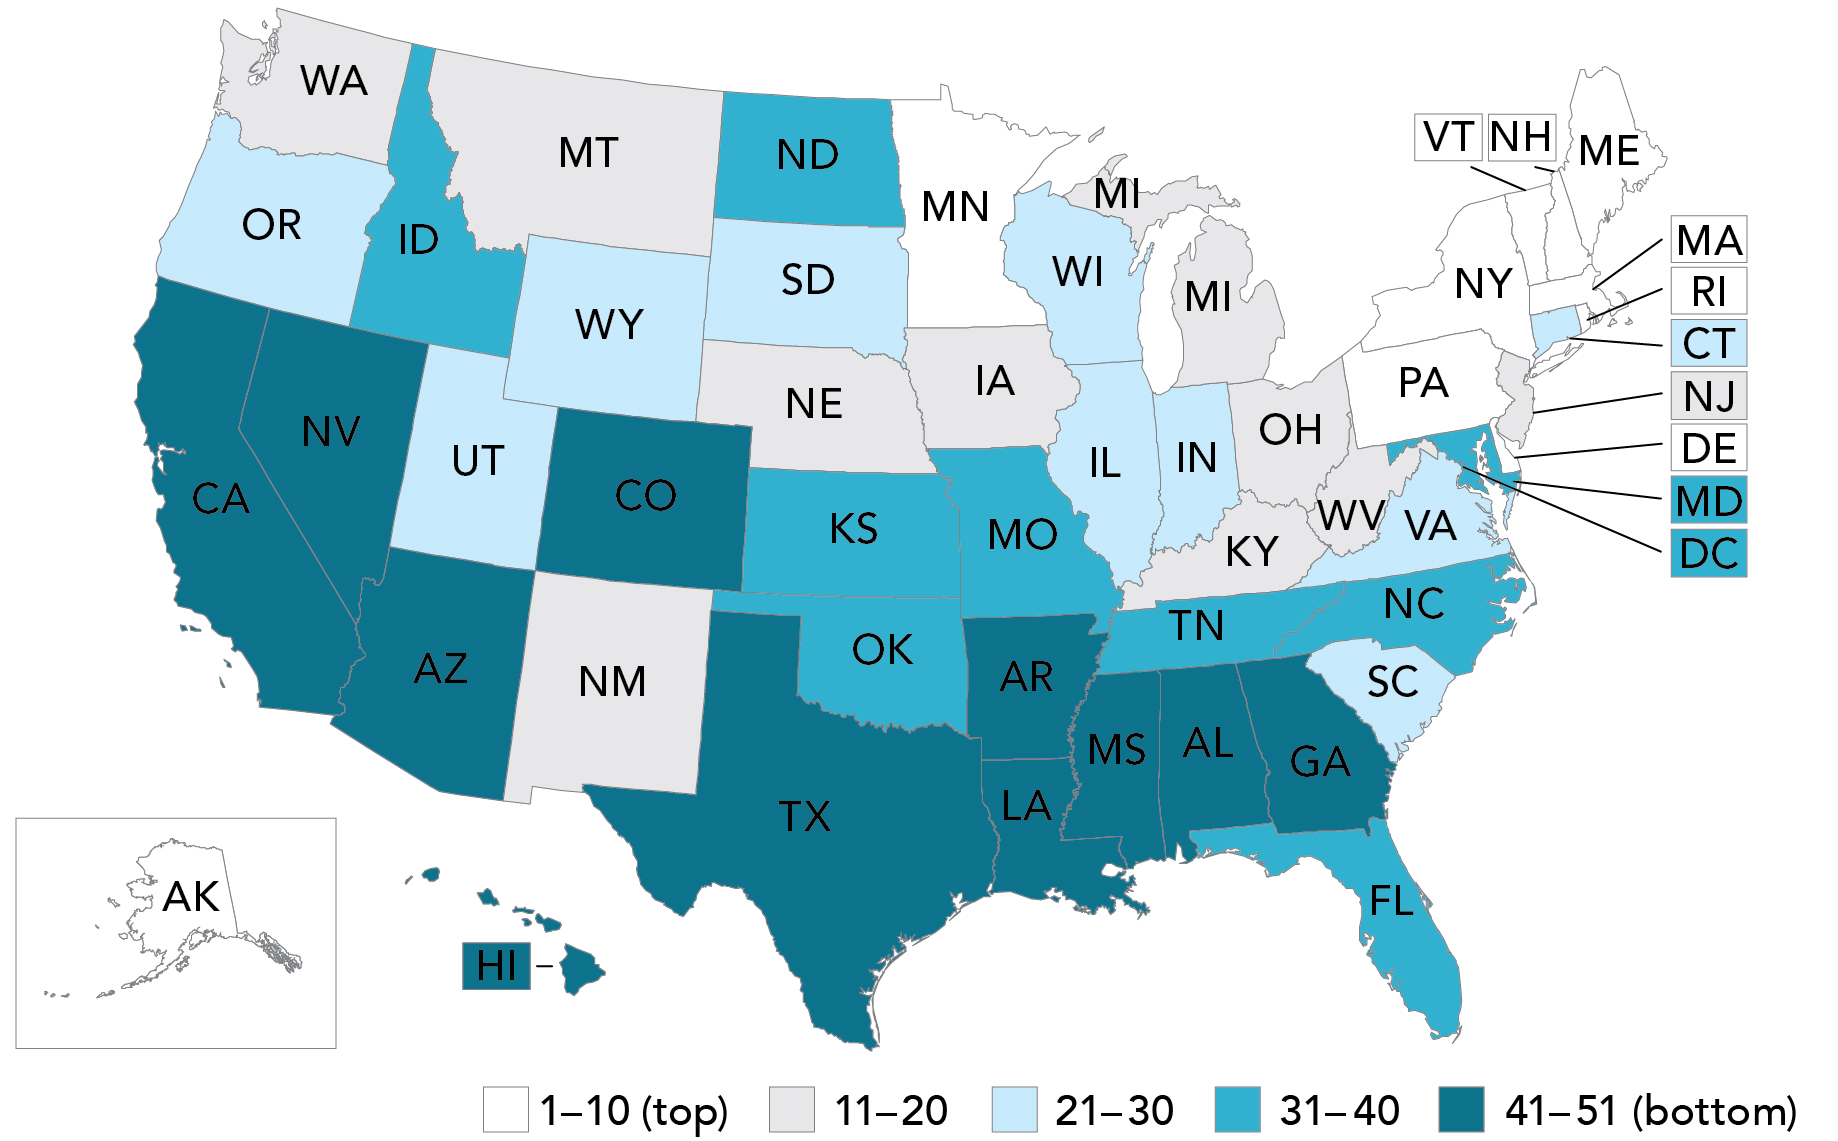
Table 7
Percentage of Homeless Students
Identified as Having a Disability
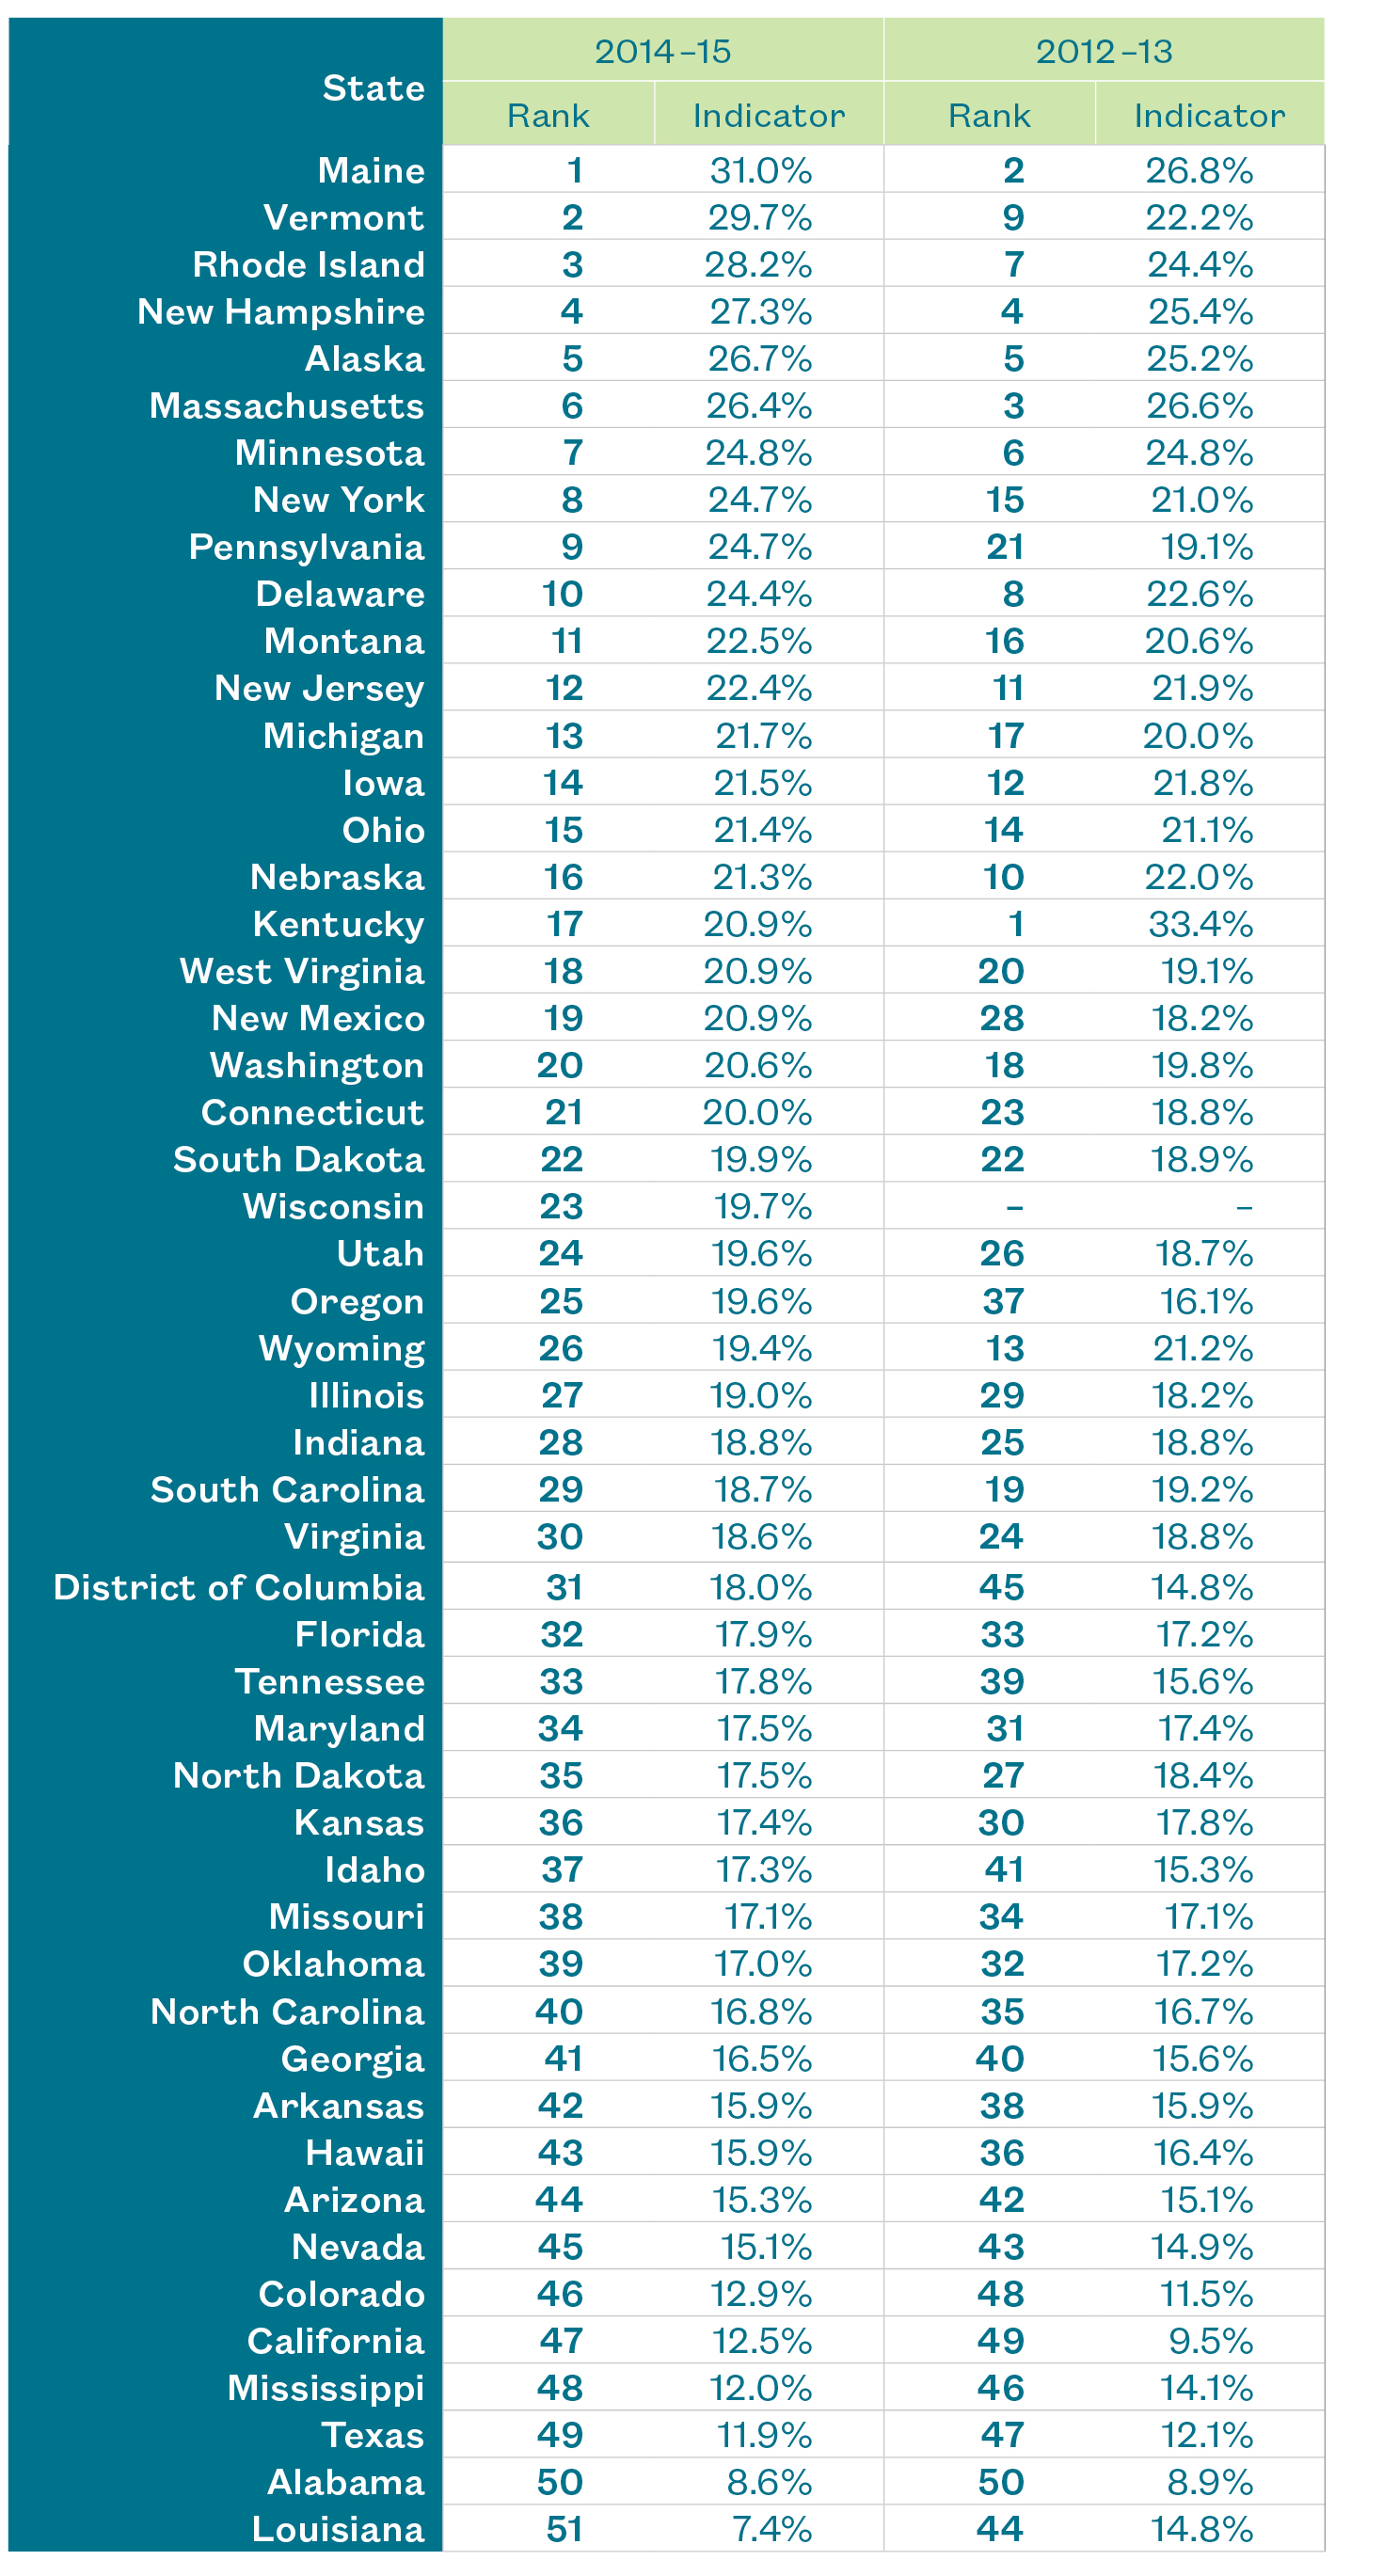
Figure 10
States Receiving Largest and Smallest
Special Education Grants
Per student with a disability in FY 2015
Federal funding that states receive through IDEA, Part B can cover as much as 40% of the excess cost of educating children with disabilities, but in recent years the federal contribution has amounted to less than 20% of the costs incurred by states. In FY 2015, the average IDEA grant to states was $1,764 per student with a disability. Louisiana received the most funding per student, $2,355, while Nevada received the least, with $1,339 per student. Nevada was, however, one of the states to receive the largest percent increase in its IDEA, Part B funding between FY 2013 and FY 2015, along with Delaware, the District of Columbia, North Dakota, South Dakota, Vermont, and Wyoming.
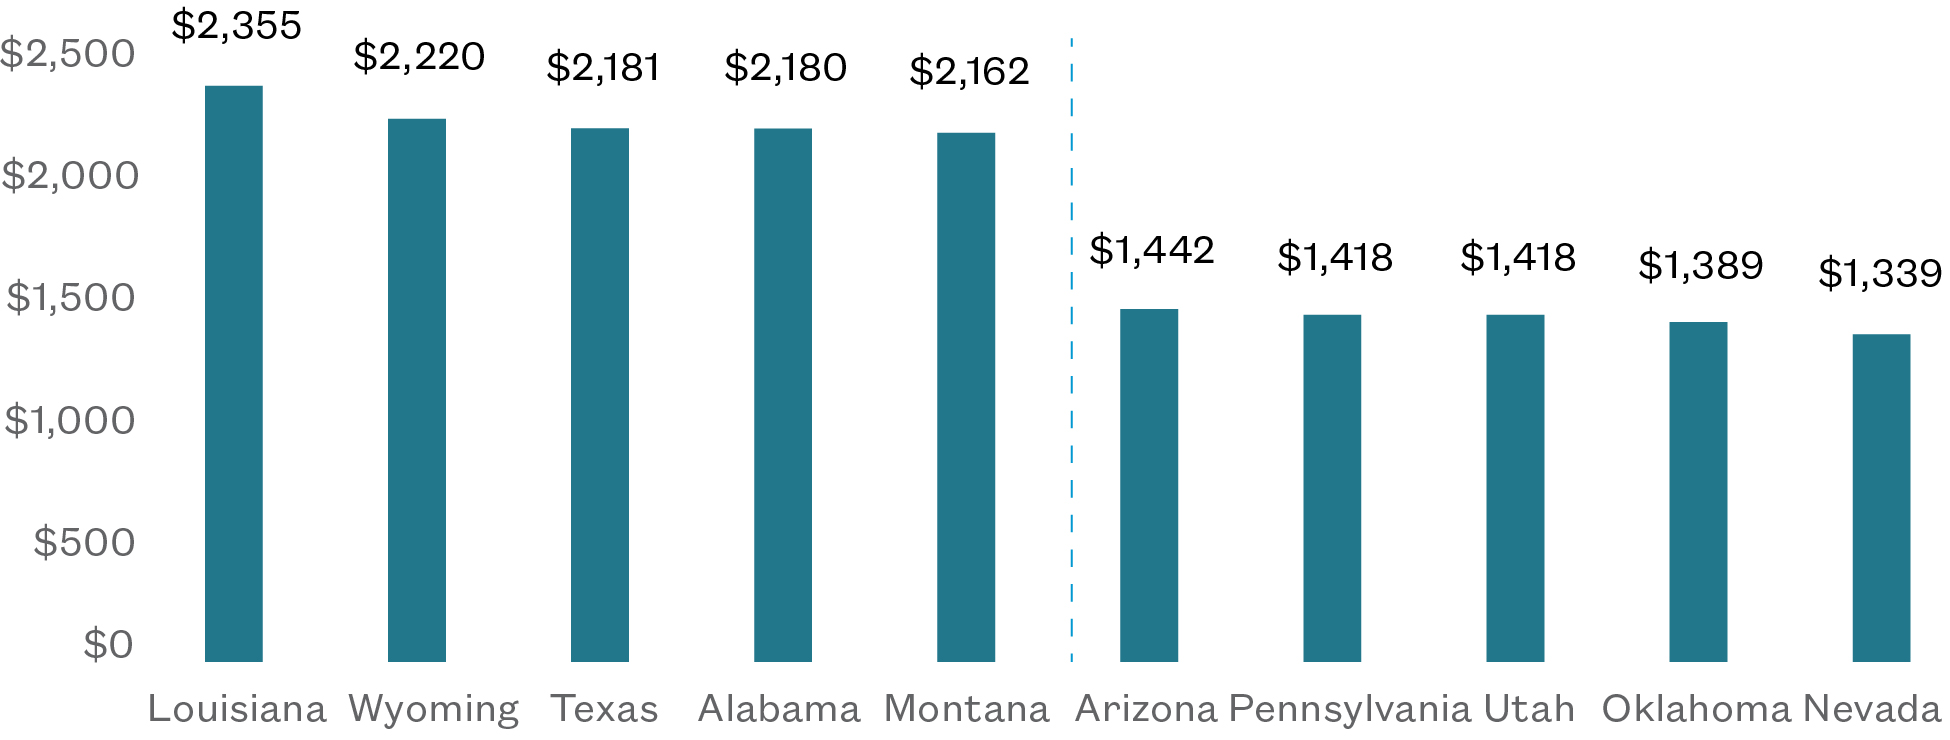
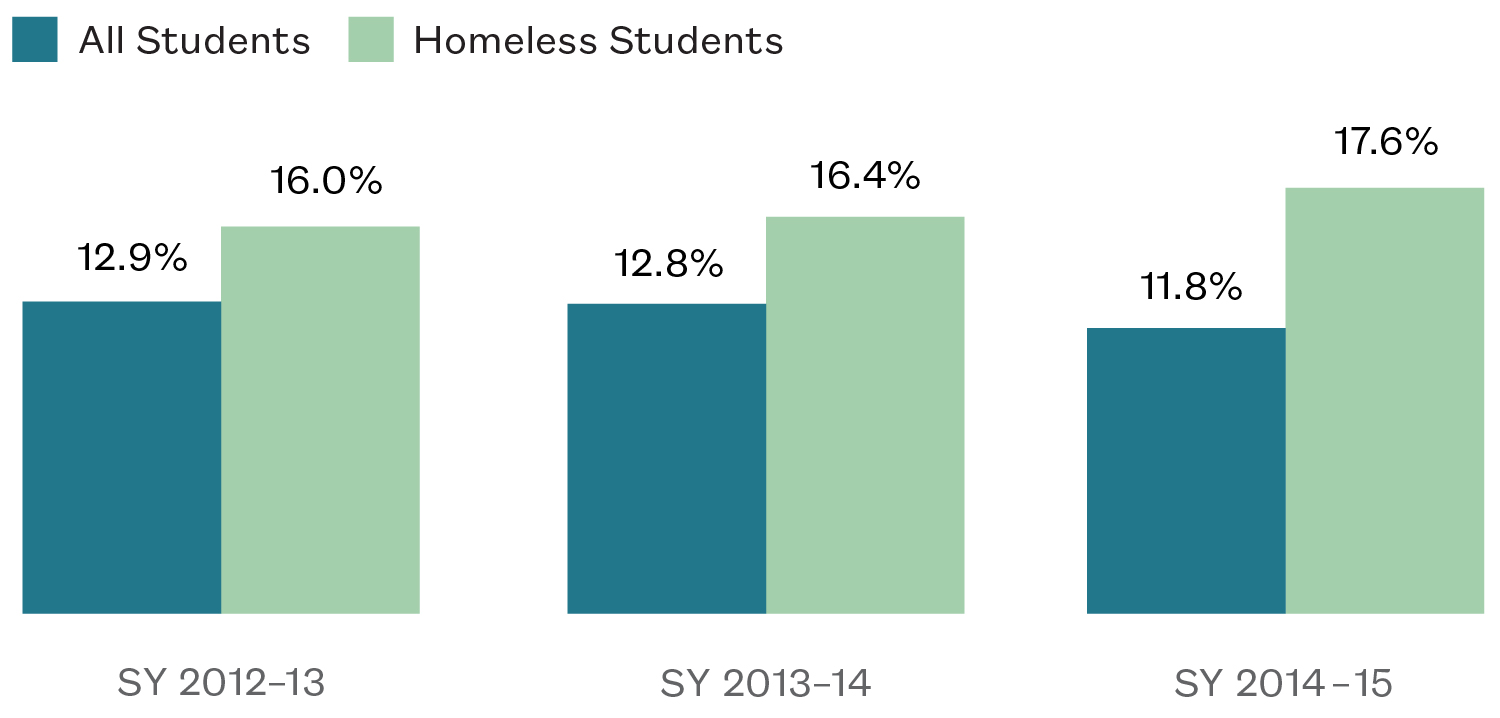
Figure 11
Percentage of Public School Students
Identified with a Disability
Compared to their peers, homeless children have three times the rate of emotional and behavioral problems, are four times more likely to show delayed development, and have twice the rate of learning disabilities. Between 2013 and 2015, the percent of homeless children identified as having a disability grew to 17.6%, compared to just under 12% of all students. In six states (Alaska, Maine, Maryland, New Hampshire, Rhode Island, and Vermont), more than a quarter of homeless students were identified as having a disability in SY 2014–15. Three states (Alabama, Louisiana, and Mississippi) had identification rates for homeless students lower than that of the total student population.
Spotlight on Maine
Number one in identifying homeless students with disabilities
“The Maine Department of Education’s ability to identify so many homeless children needing special education services may be attributed to frequent training and guidance.”
Maine has long recognized the importance of proactively identifying children with disabilities. In addition to offering federally-mandated services to students, the Maine Department of Education often hosts workshops and webinars, and produces guidelines to aid educators in the identification and evaluation of children with support needs. Maine’s approach to helping educators is paying off, as Maine ranked first among all states in identifying homeless students with disabilities in SY 2014–15.
Previously, Maine was ranked as the second-highest state for identifying homeless students with disabilities. In SY 2012–13, Maine enrolled 2,070 homeless students, 26.8% of whom were identified as needing special education services. In SY 2014–15, Maine enrolled 1,934 homeless students and identified 31% of those students as needing special education services.
In Maine, the Office of Special Services within the Department of Education oversees and supports the state’s delivery of all special education services for children with disabilities from birth to age 20. The Department of Education also oversees the implementation of McKinney-Vento, which guarantees the right to a free, appropriate, public education, and may include special education services. The Maine Department of Education’s ability to identify so many homeless children needing special education services may be attributed to frequent training and guidance. Currently, the state’s Child Development Services System has nine regional sites which conduct early intervention screenings and provide case management, while the statewide office maintains a central data system.
As part of Maine’s latest State Performance Plan, the state provides training on alternate years to educators who have been in the field for less than two years at their New Directors Academy. The state Department of Education also hosts webinars providing professional development and technical assistance to administrators working in special education. Additionally, the state receives a State Personnel Development Grant from the federal government, aimed to help school districts improve their professional development systems for special education instructors.
Spotlight on District of Columbia
Most improved in identifying homeless students with disabilities
“The increase in the percentage of homeless students identified as needing special education services in D.C. demonstrates the city’s improvement in identifying disabilities among this population.”
The District of Columbia has made great progress in recent years to provide appropriate special education services. Historically D.C. has struggled to comply with IDEA, but recent funding and guidance from the federal government appears to have improved the District’s compliance. For years, D.C. has been on the federal government’s “need intervention” list and was named a “high-risk grantee” for federal special education funds. Homeless children are more likely than their housed peers to need special education services, but they are harder to identify because of factors like high mobility and chronic absenteeism.
Between SY 2012–13 and SY 2014–15, D.C. became the most improved state in identifying homeless children with disabilities. In SY 2012–13, D.C. ranked 45th and identified 3,766 homeless students, 14.8% of whom received special education services. In SY 2014–15, D.C. ranked 31st and identified 3,580 homeless students. Eighteen percent of those students received special education services. The increase in the percentage of homeless students identified as needing special education services in D.C. demonstrates the city’s improvement in identifying disabilities among this population.
In D.C., special education services are provided through the Office of the State Superintendent of Education—Division of Specialized Education (OSSE-DSE). The Office of the State Superintendent of Education is responsible for the early intervention program Strong Start for children from birth to age three. For children ages three to five, D.C.’s Early Stages assessment center evaluates children who may have special needs and connects them with appropriate services. The District of Columbia Public Schools’ special education programs and services are influenced by the District’s four strategic goals for school years 2016–2019, which aim to increase academic achievement, include more students, involve families in children’s successes, and prepare students for college and the workforce. These goals are more difficult to meet for children experiencing homelessness who need special education services. For example, parents of homeless children may be less involved in their child’s education as a result of the time dedicated to finding stable housing and employment.
To better support its special education teachers and personnel, D.C. has begun to create advisory panels, white papers, and other forms of guidance. In recent years, OSSE-DSE and the District of Columbia State Advisory Panel on Special Education have provided best practices and other forms of guidance to help identify and serve children with disabilities. In 2012, OSSE-DSE released a white paper recognizing District of Columbia Public Schools and thirteen charter schools for their progress in serving children with disabilities.
In 2014, OSSE-DSE began reviewing the key components of the local regulations governing special education in the District of Columbia. In 2015, The District of Columbia State Advisory Panel on Special Education’s annual report provided an overview of the major concerns and issues raised during the previous academic term, as well as recommendations and benchmarks for future improvement. According to the report, there were over 12,000 students in D.C. receiving services under IDEA in SY 2014–15, an increase of over a thousand students from the previous year.
IDEA requires that every state create a State Performance Plan, in which it specifies how it will evaluate its implementation of IDEA and improve student performance among children with disabilities. A new indicator in the State Performance Plan is the State Systemic Improvement Plan, which was created to push states to focus on improving in one priority area. The 2014–15 annual report concluded that the top priority of OSSE-DSE should be increasing the graduation rates of students with disabilities.